Mission Control for GitOps
A lightweight, mobile-friendly web interface providing real-time visibility into your GitOps pipelines. Embedded directly within the Flux Operator, it requires no additional installation.
Features
Real-time Visibility
View the real-time status and readiness of all workloads managed by Flux across your cluster.
Pinpoint Issues
Quickly identify and troubleshoot failures within your app delivery pipelines with detailed error messages.
Advanced Search
Use powerful search and filtering to find specific resources instantly across all namespaces.
Deep Dive Dashboards
Access dedicated dashboards for ResourceSets, HelmReleases, Kustomizations and Flux sources.
Favorites
Mark important resources as favorites for quick access and at-a-glance status monitoring.
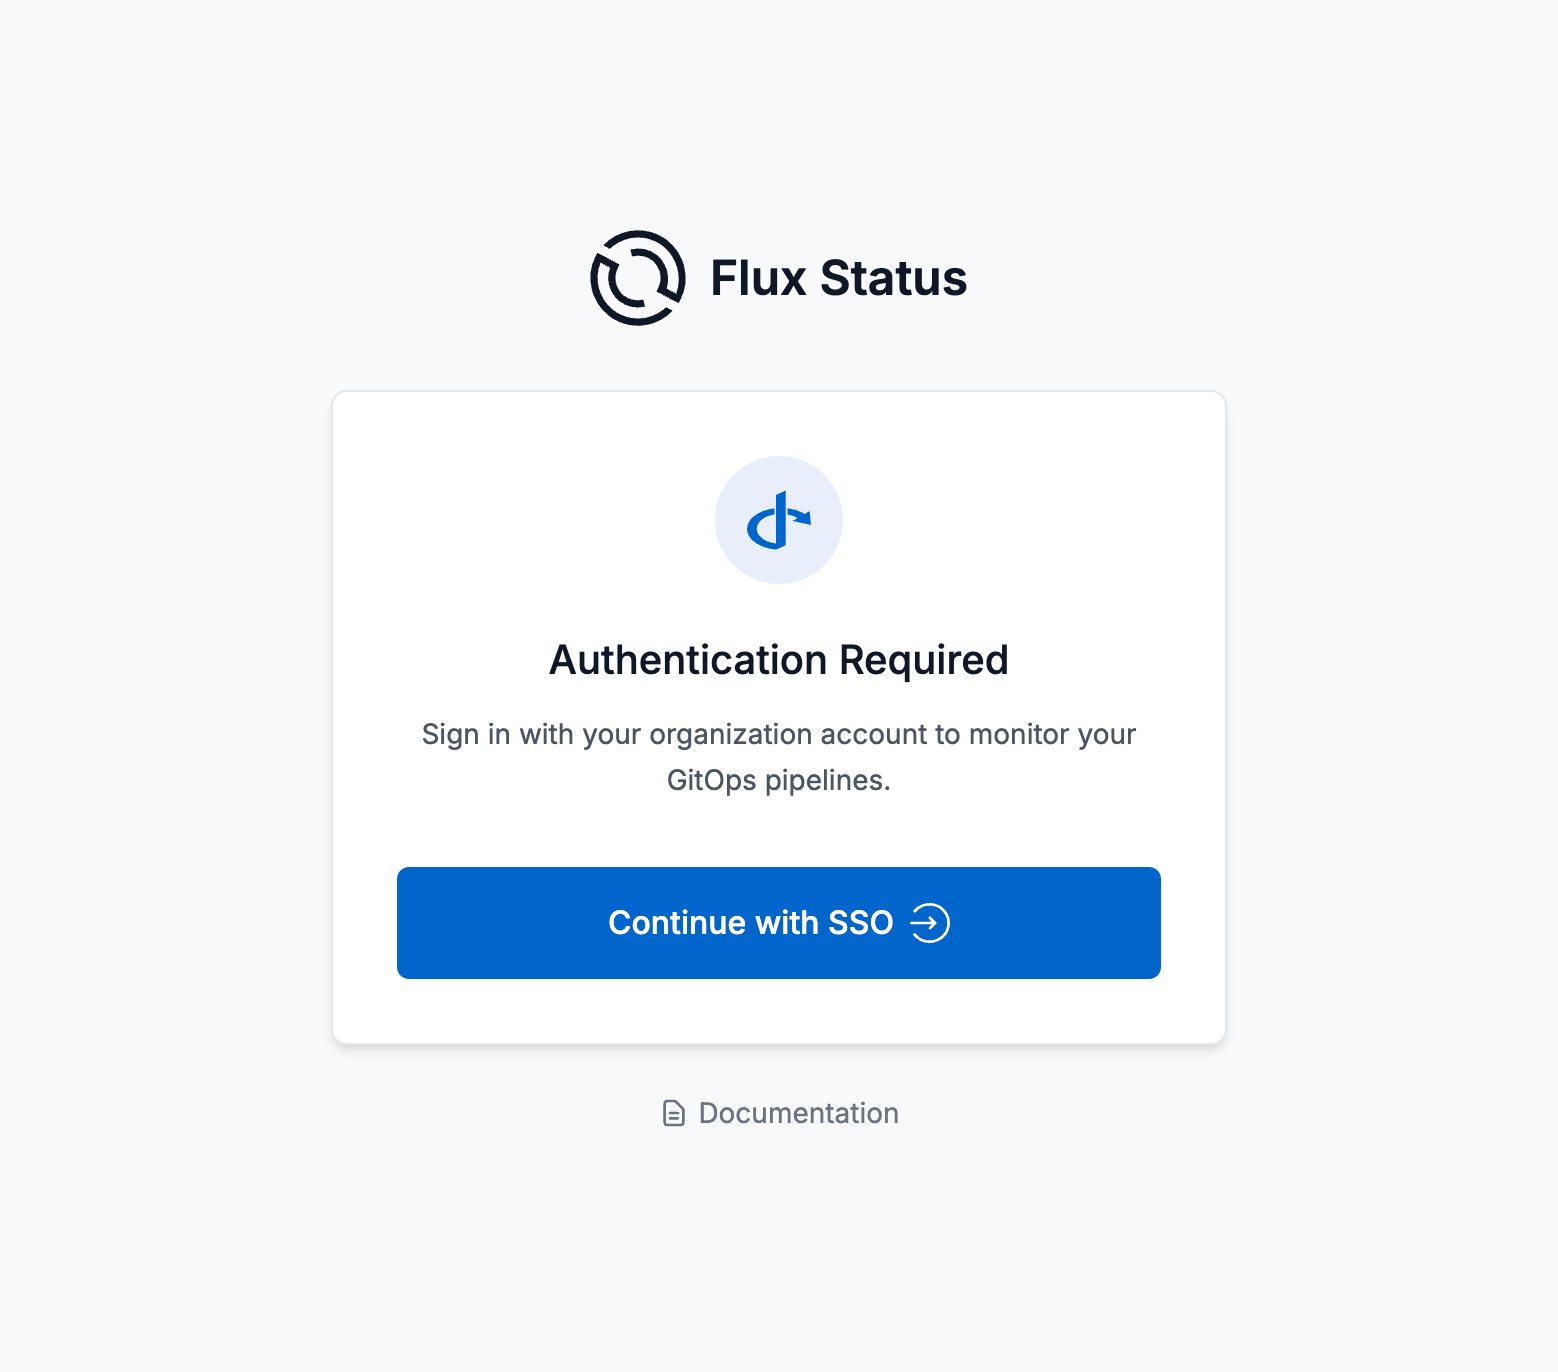
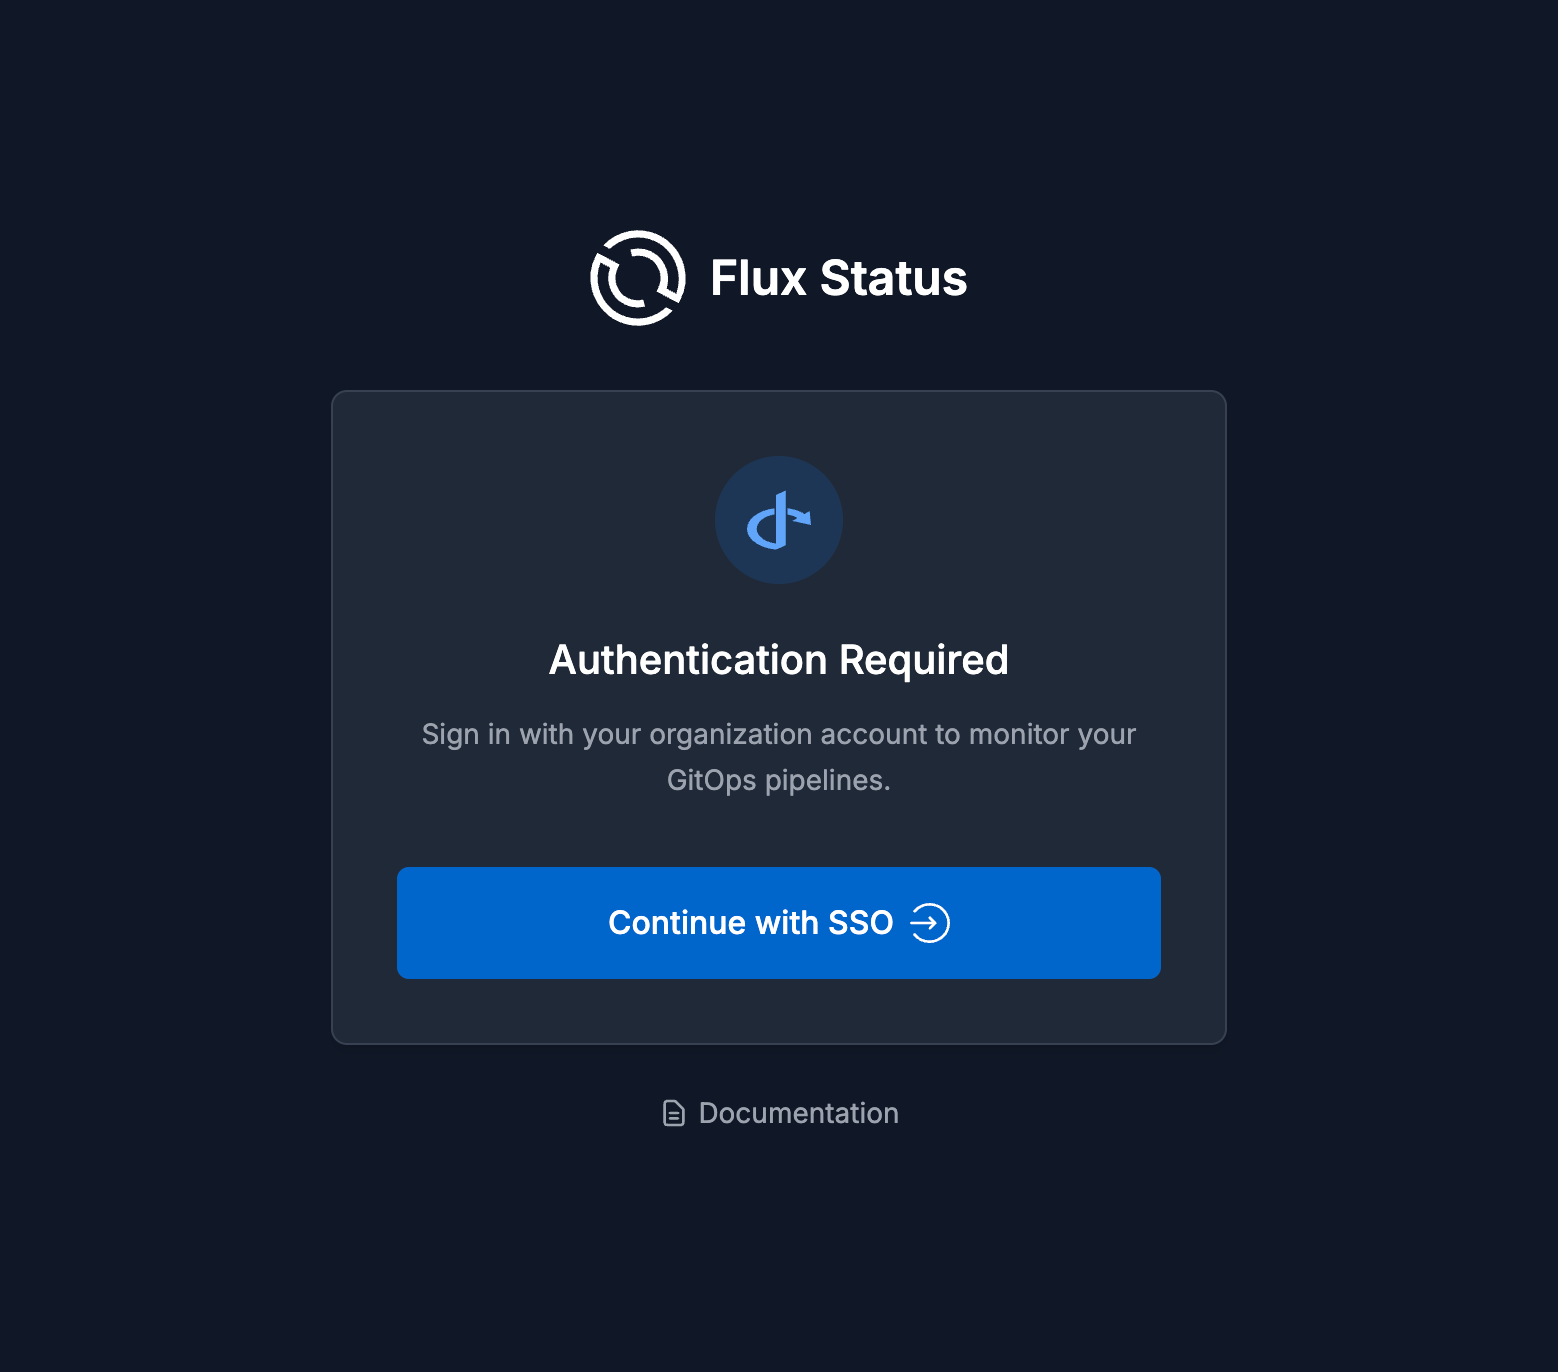
Single Sign-On
Securely access the UI using OpenID Connect and Kubernetes RBAC policies mapped to your identity provider.
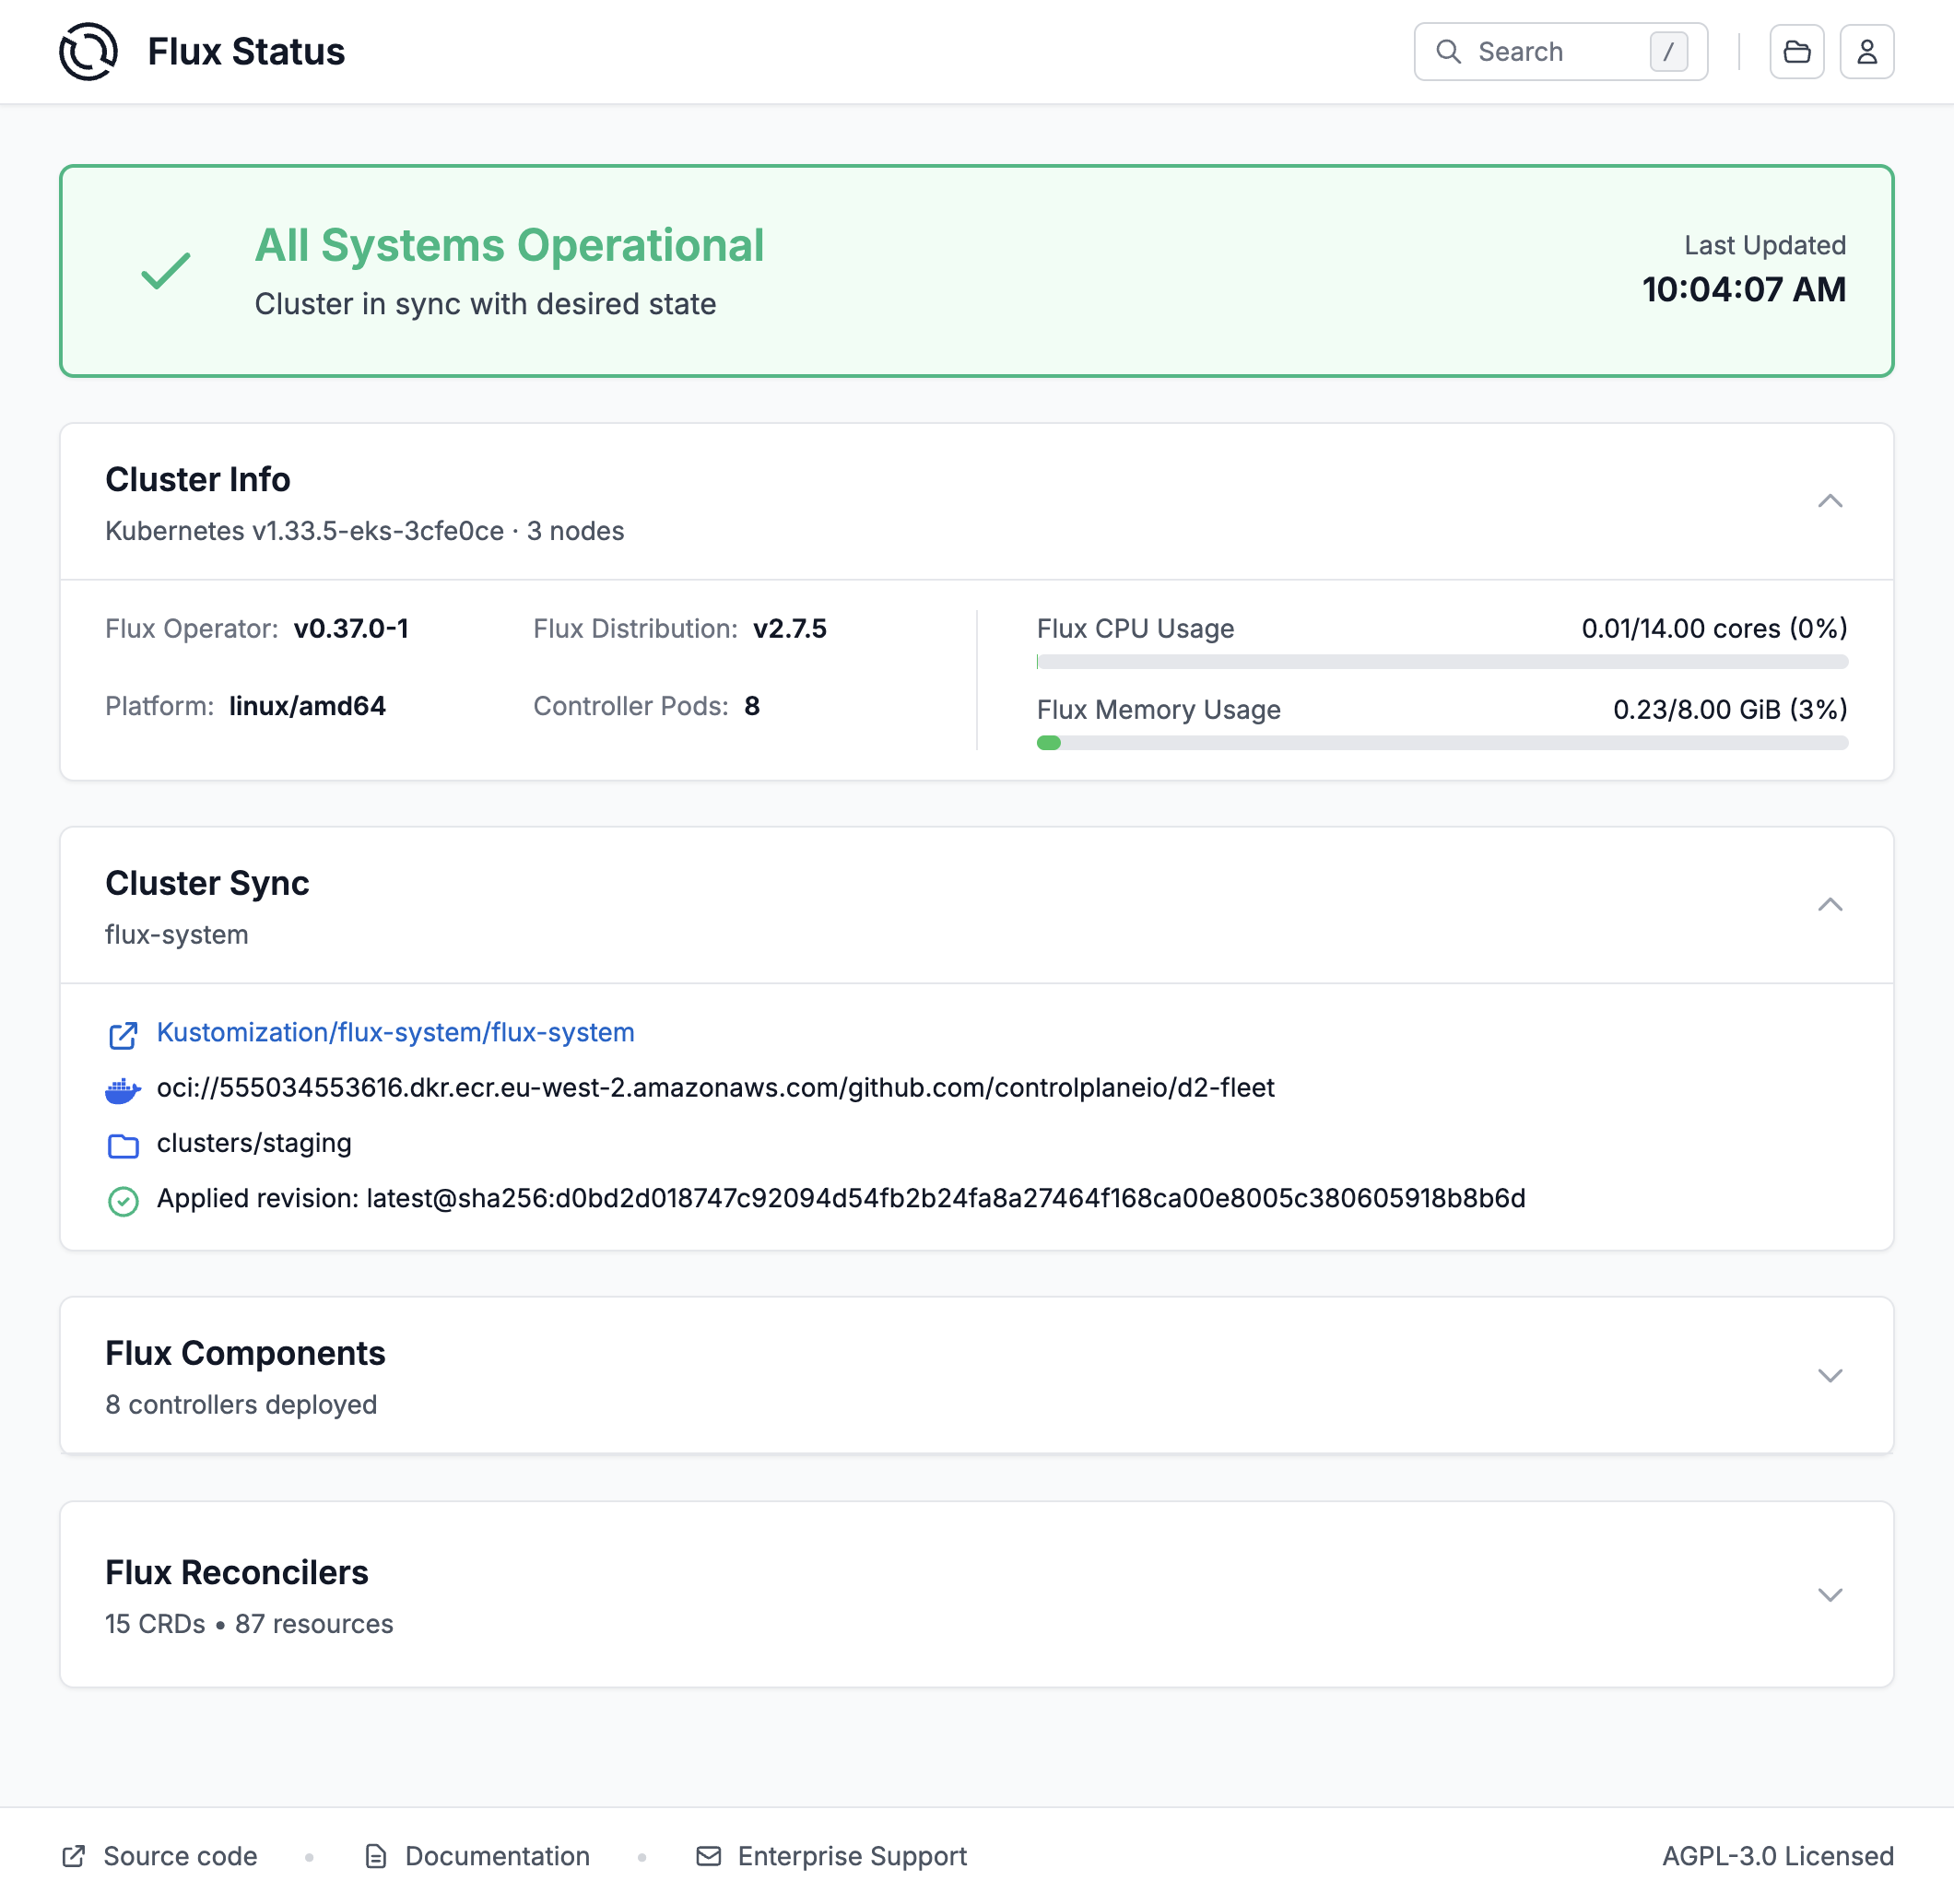
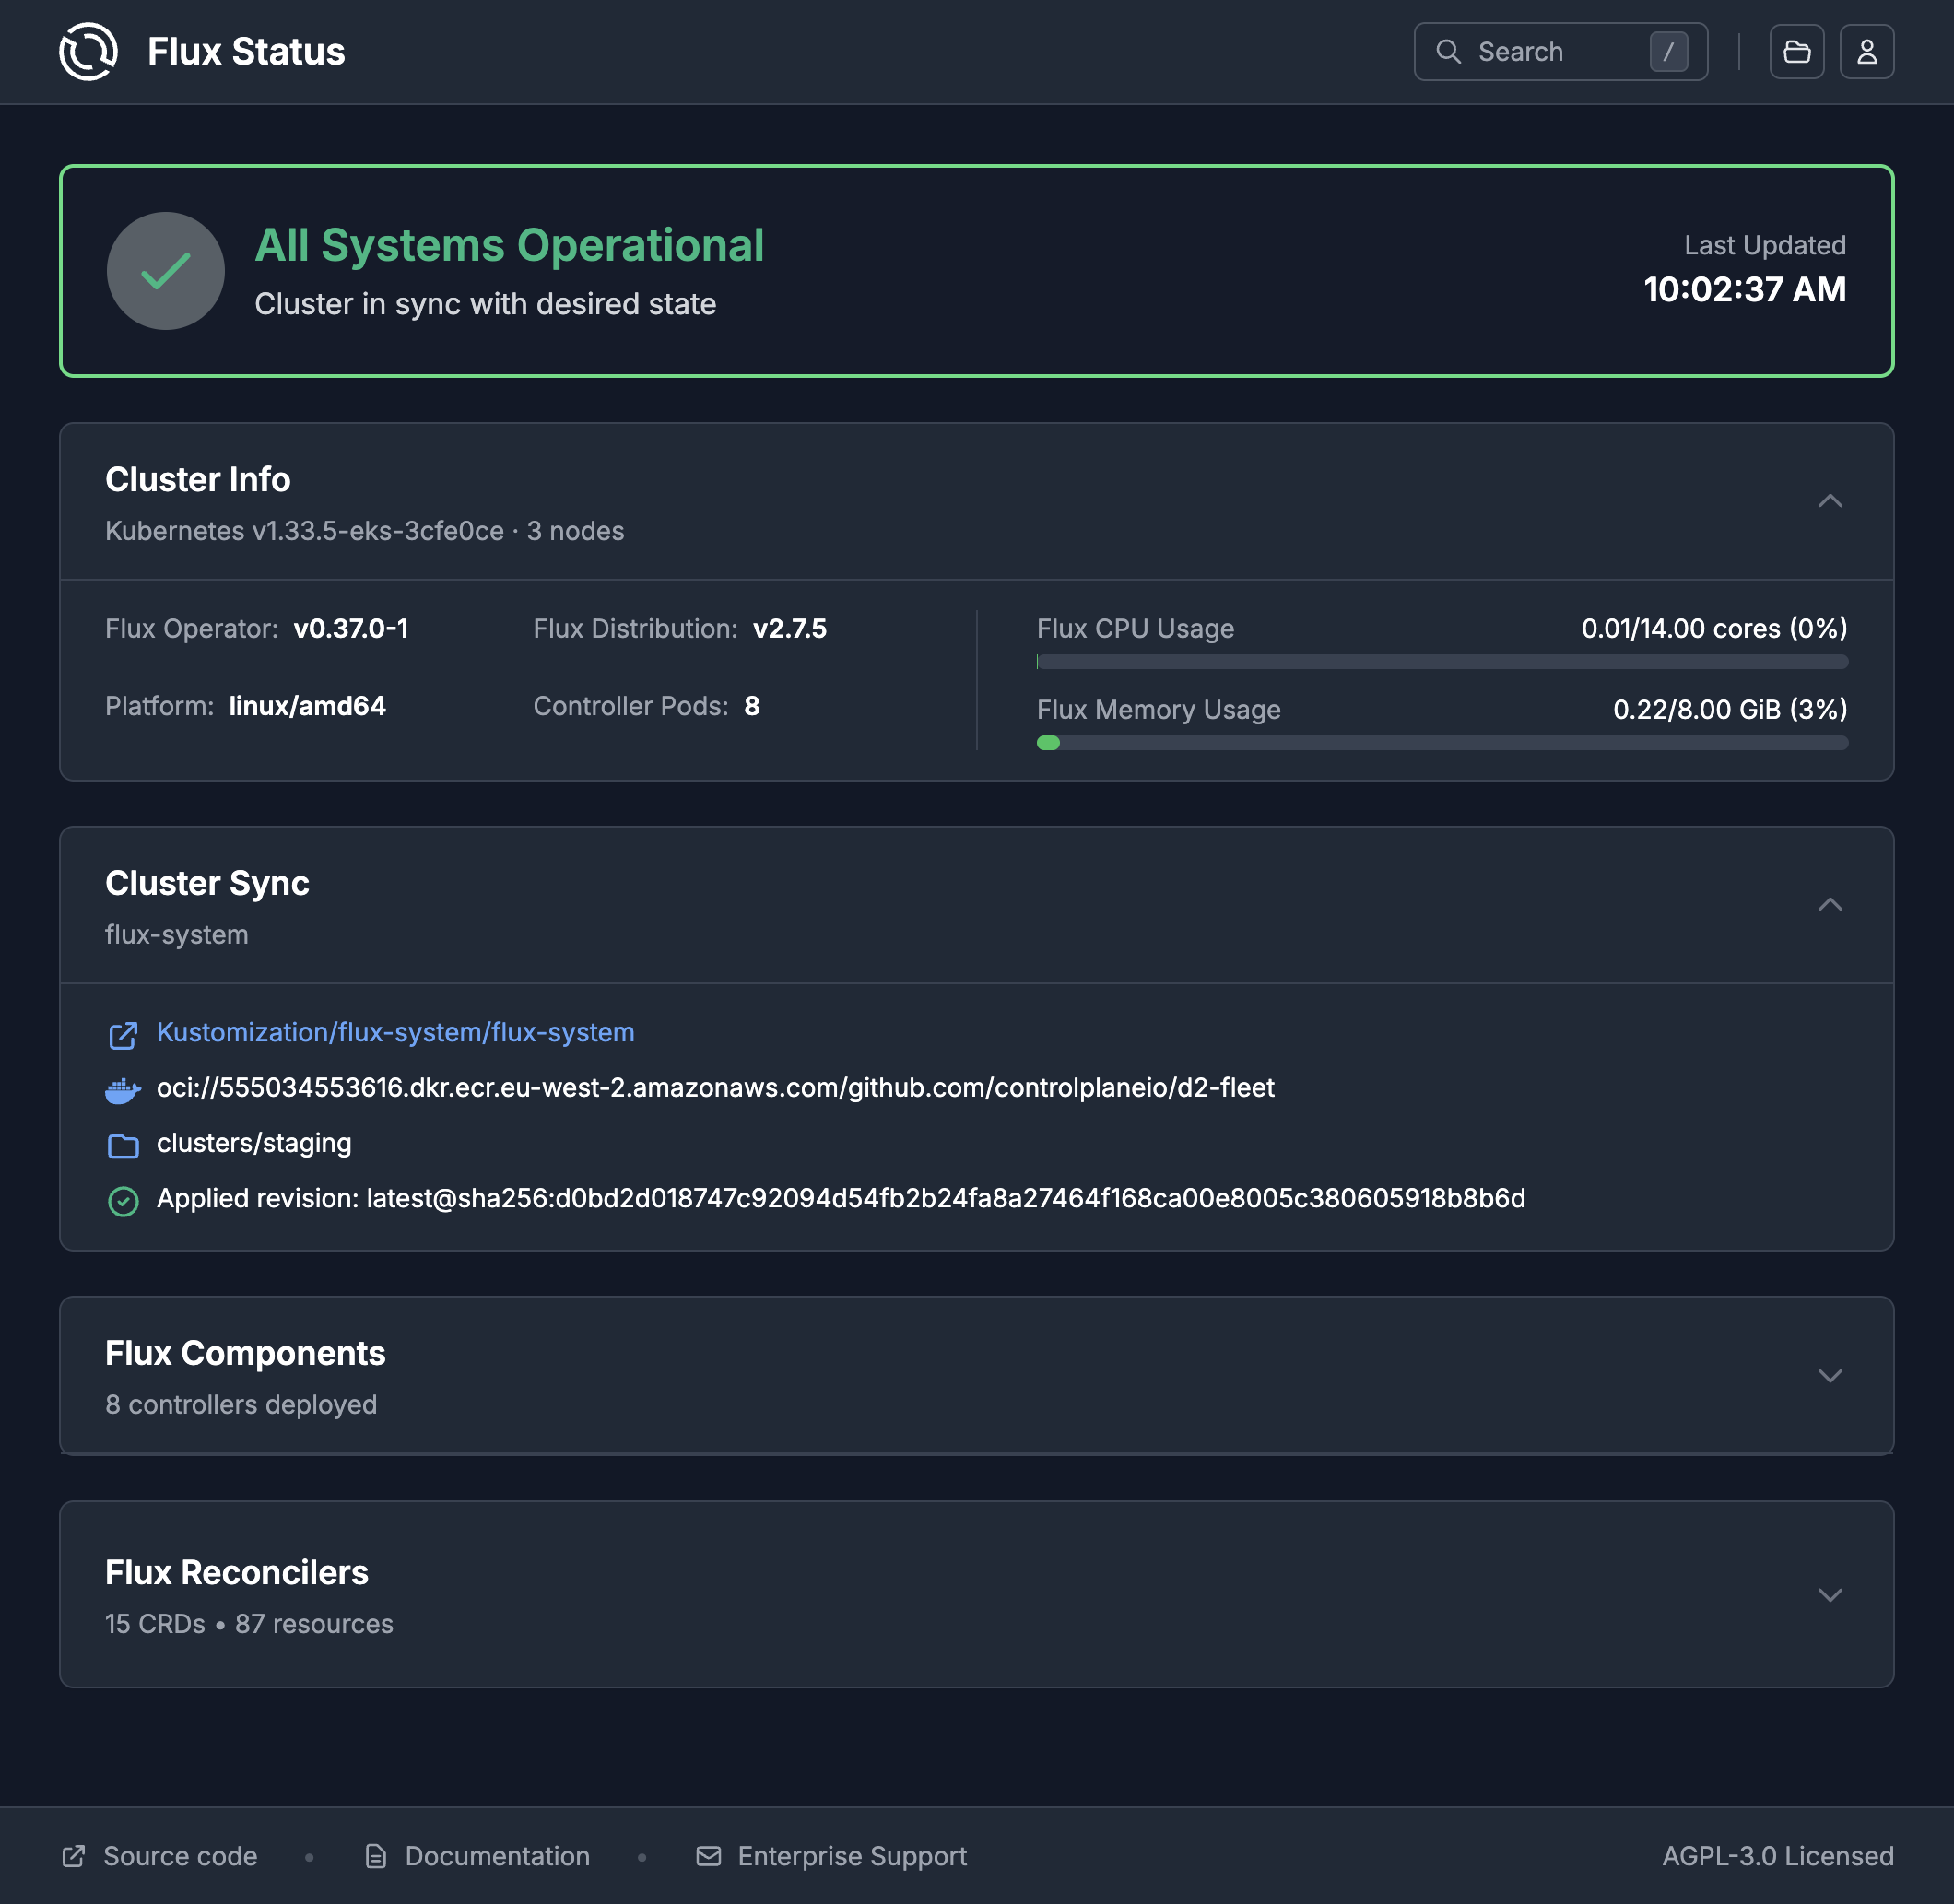
Cluster Dashboard
Get a complete overview of your Flux installation at a glance. The cluster dashboard displays the status of all Flux controllers, recent reconciliation activity, and quick stats about your GitOps resources including Kustomizations, HelmReleases, and source repositories.
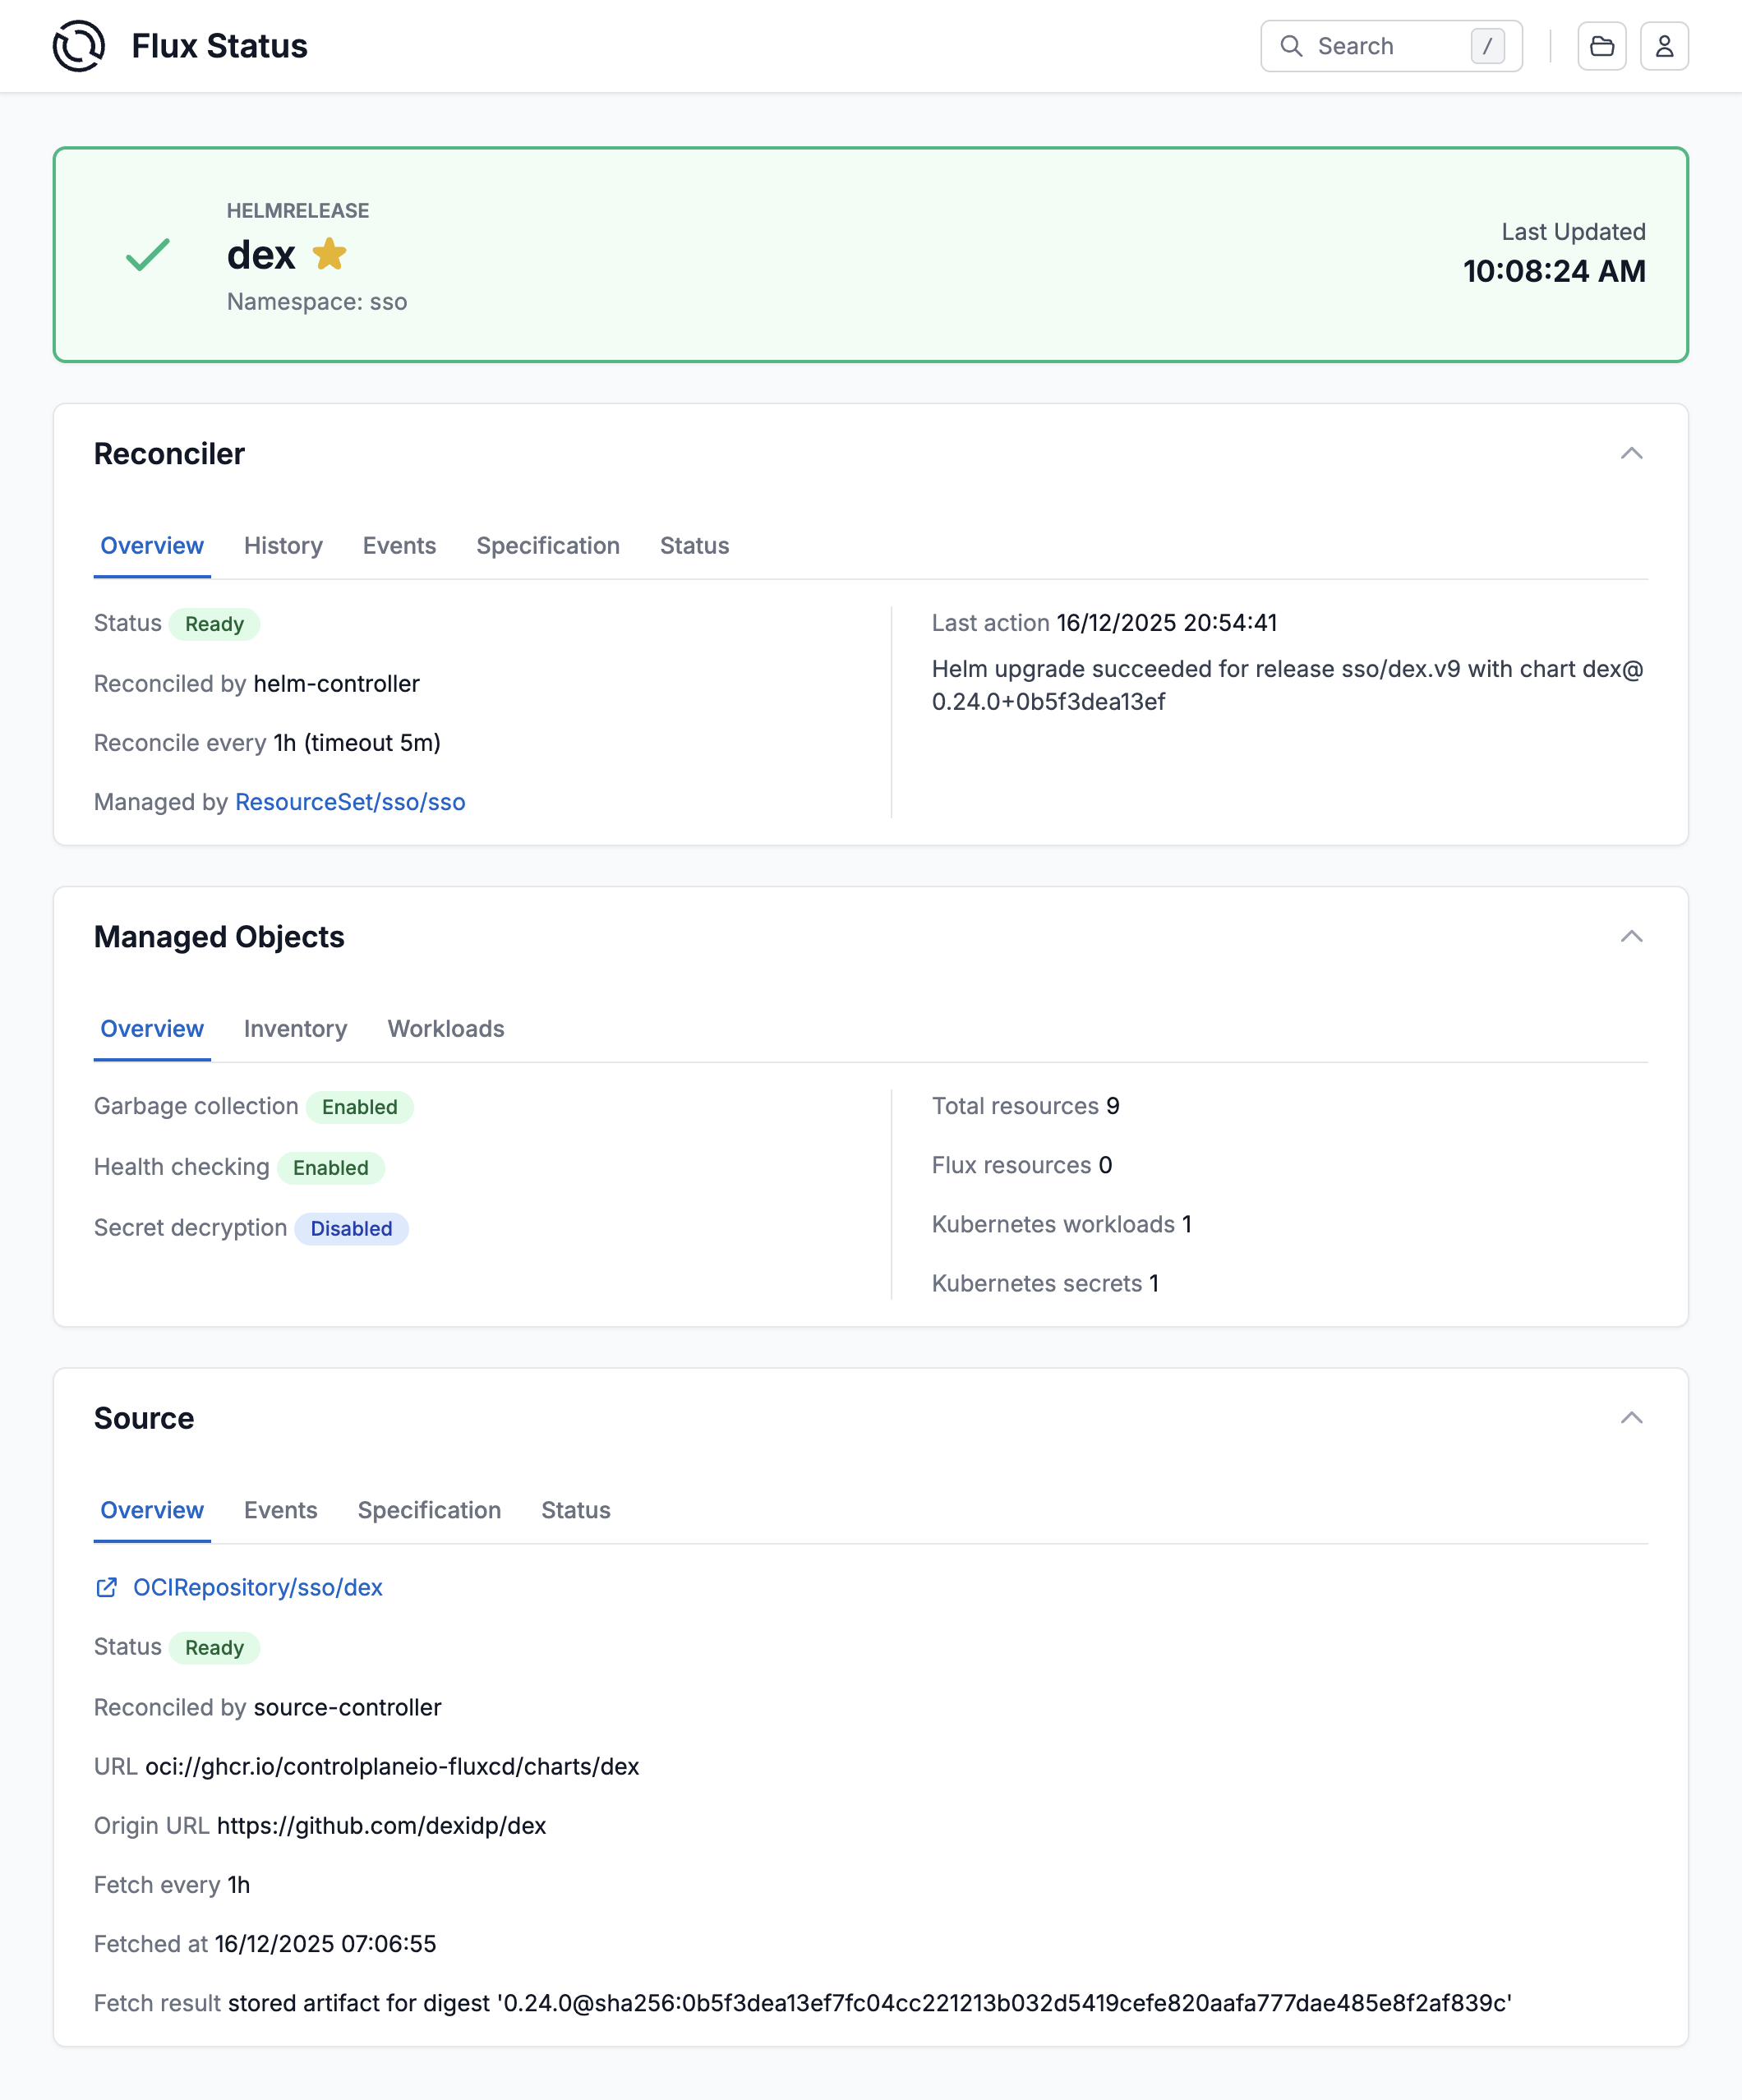
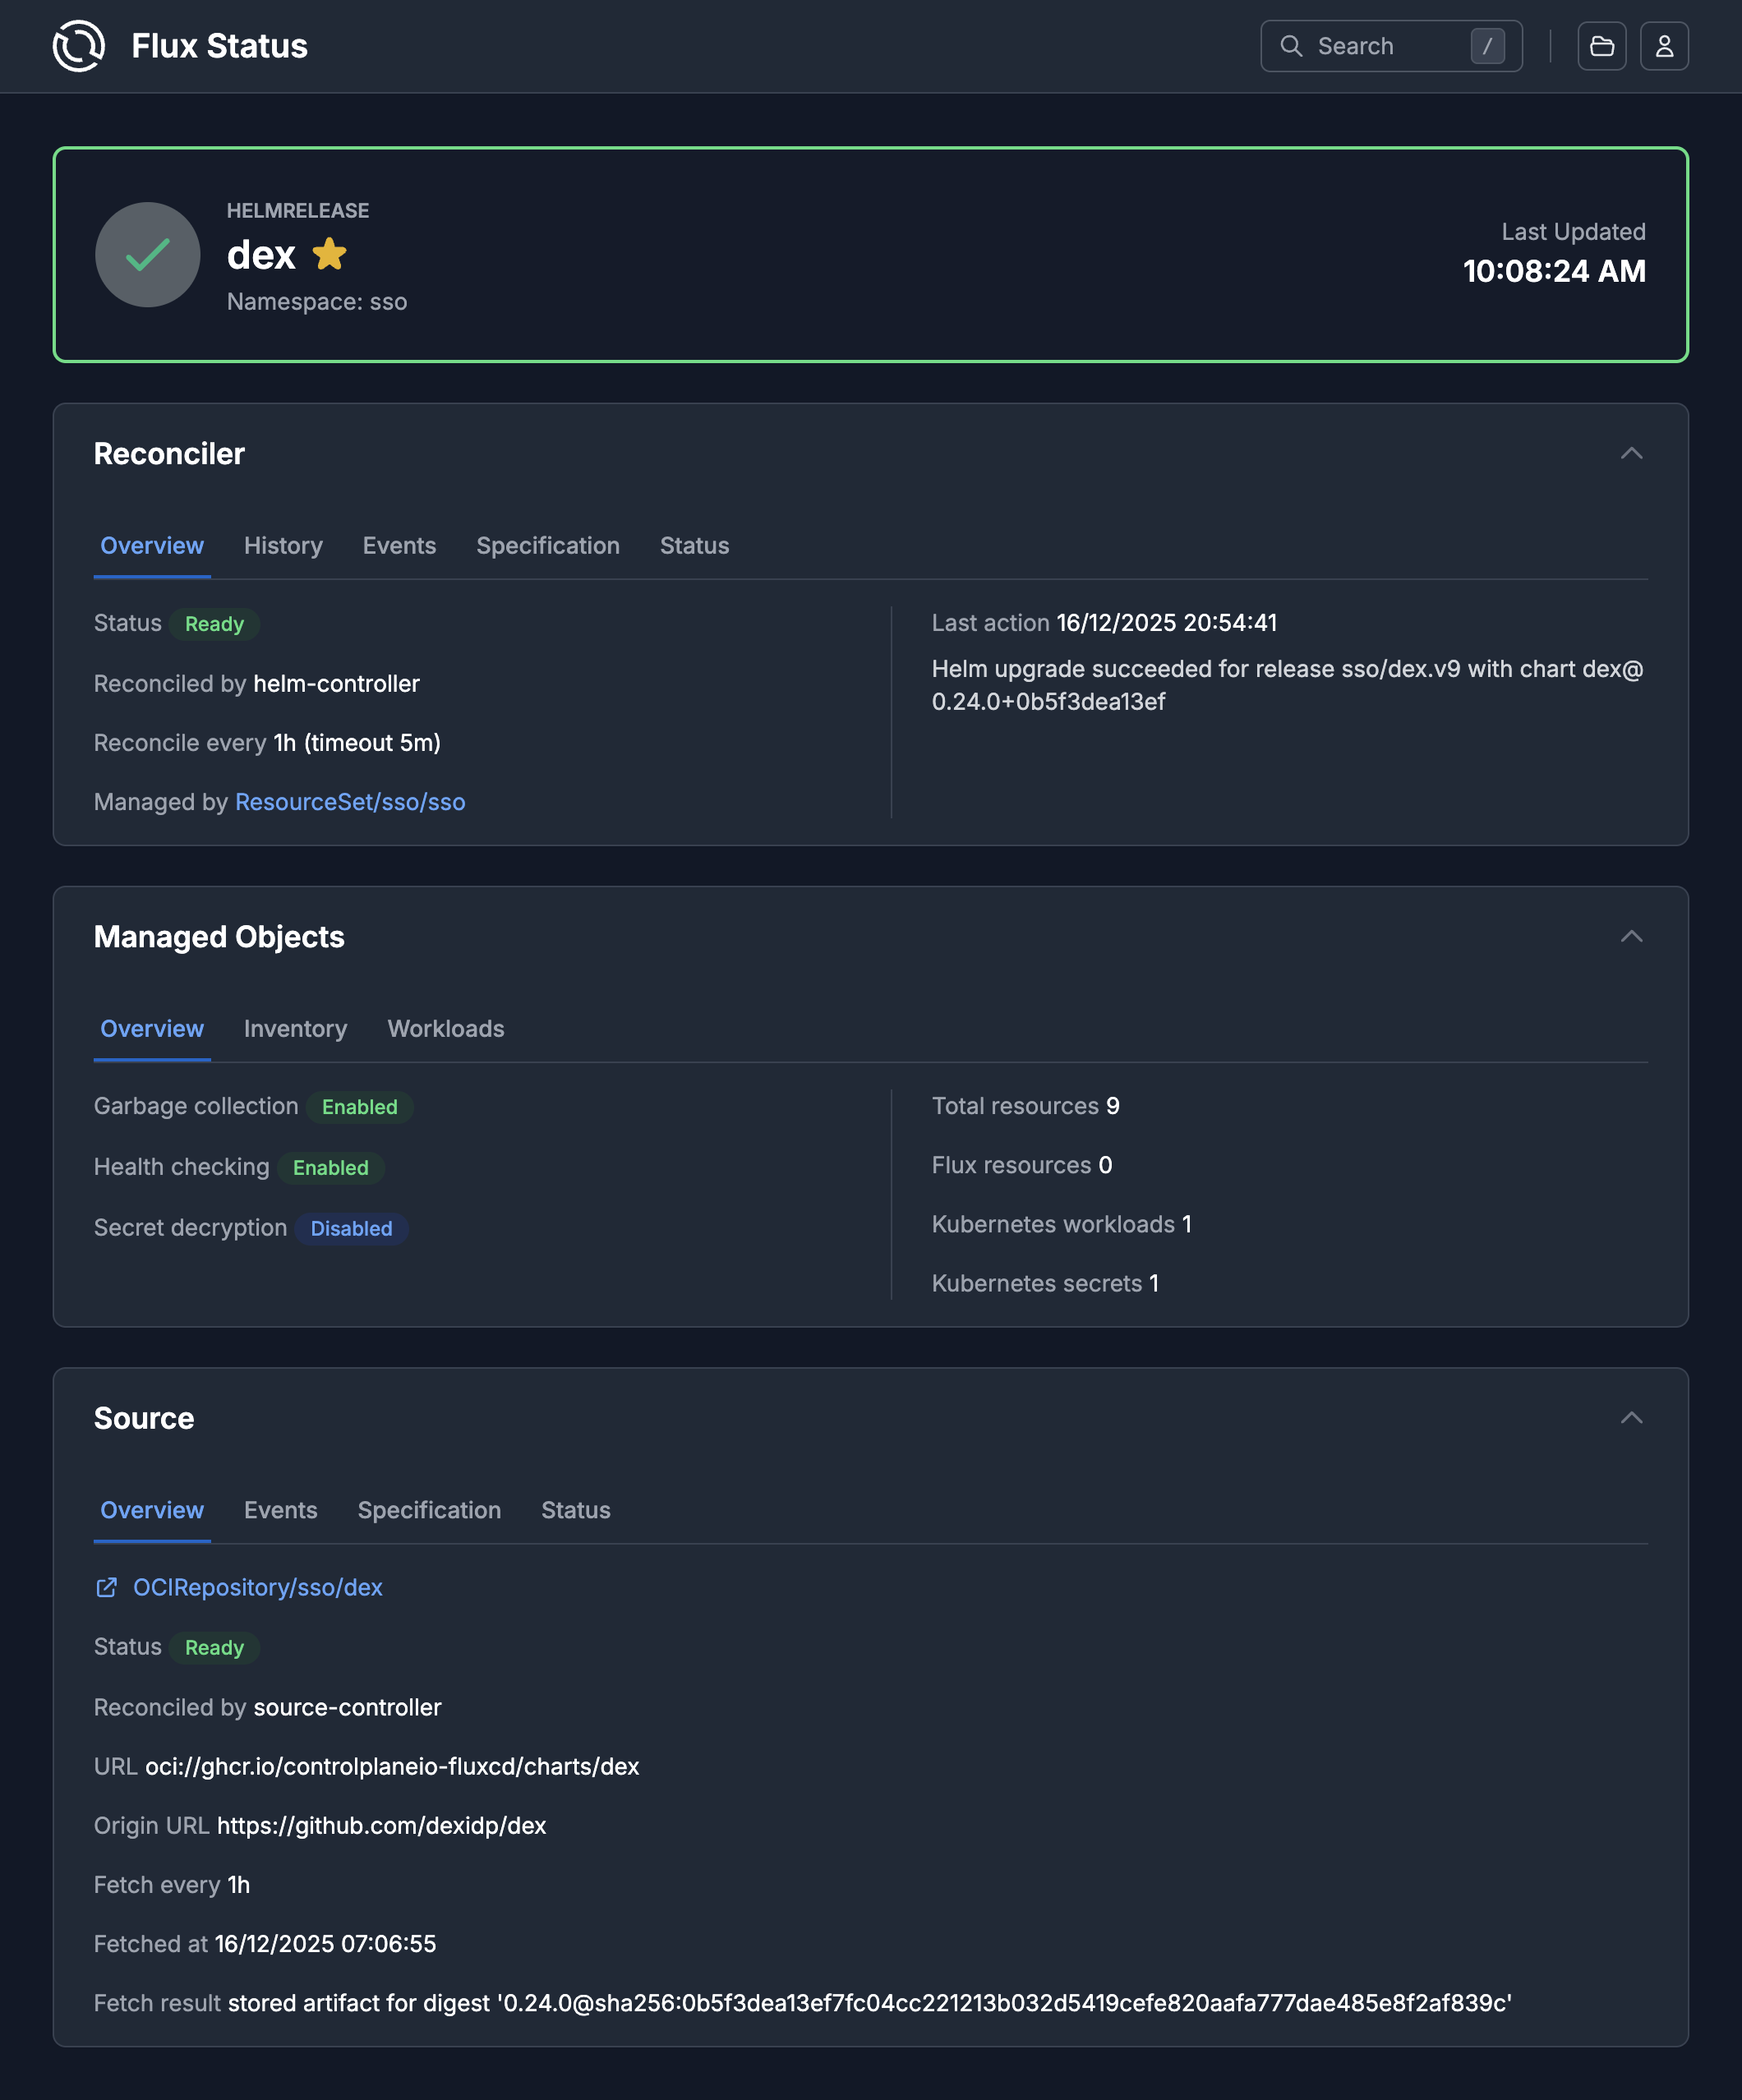
Helm Release Dashboard
Dive deep into individual HelmRelease configurations. View the current state, revision history, applied values, and any conditions or errors. Trigger Flux actions such as reconcile, suspend and resume - guarded by Kubernetes RBAC.
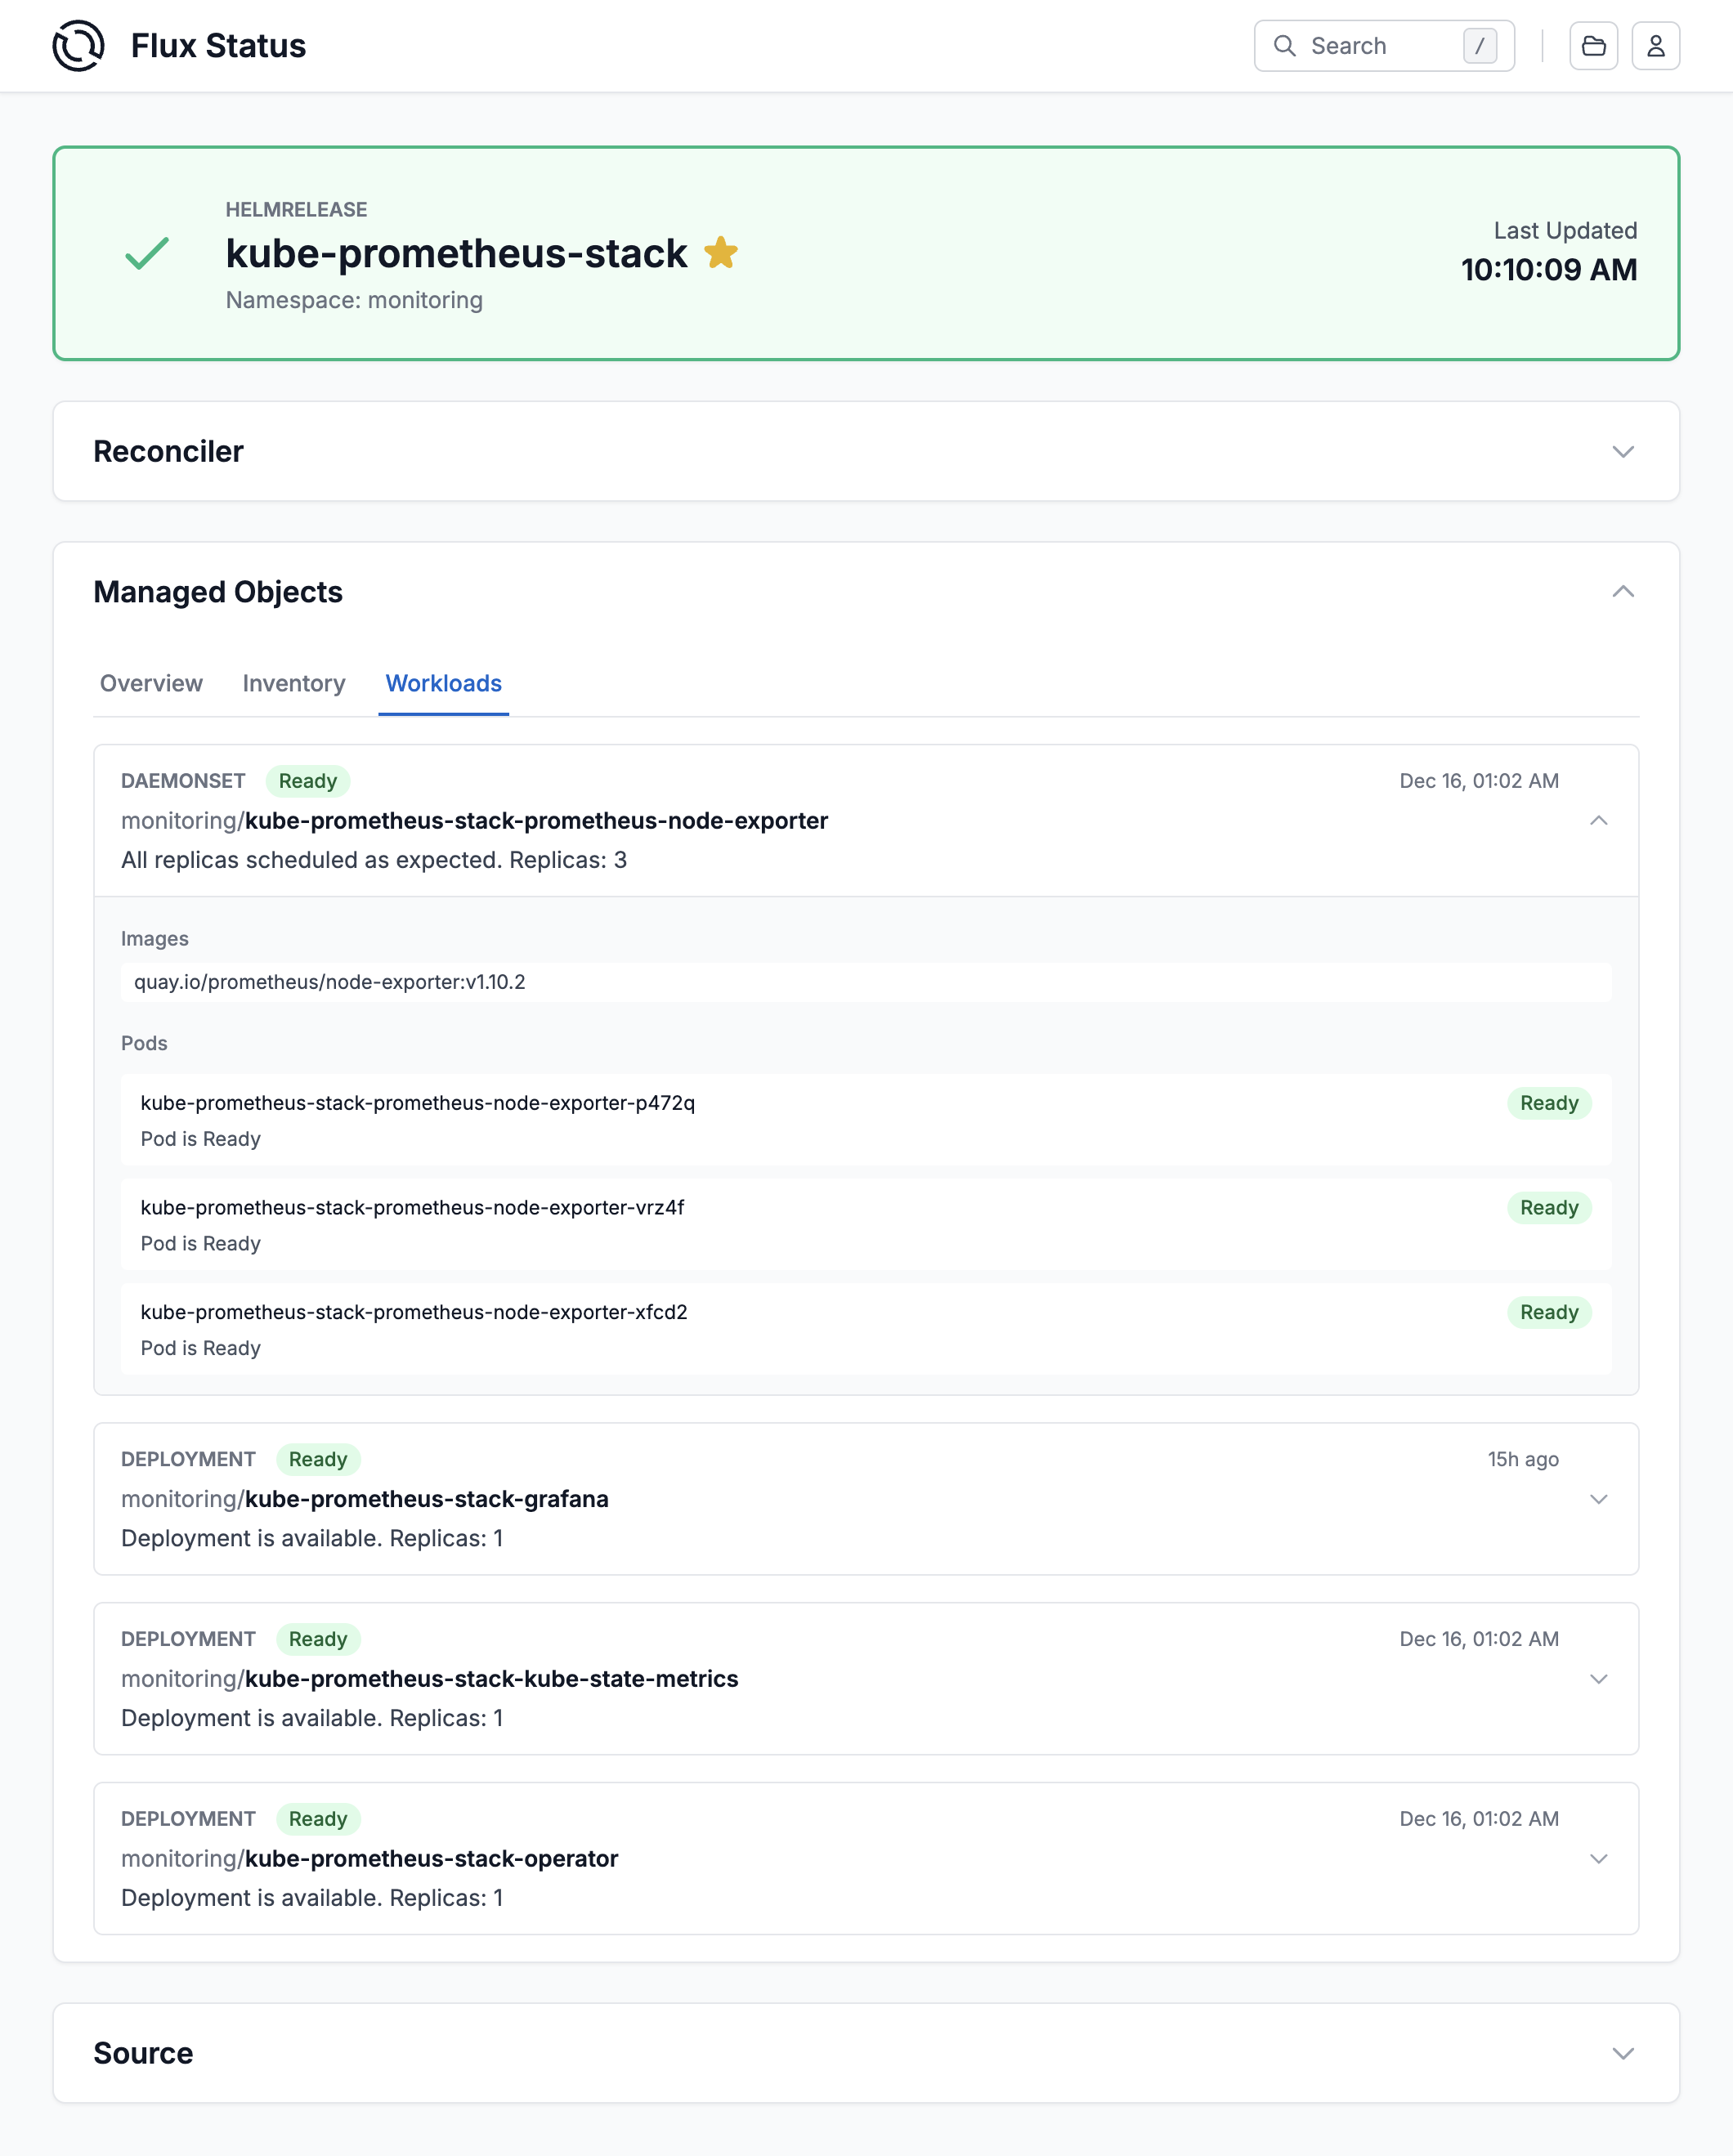
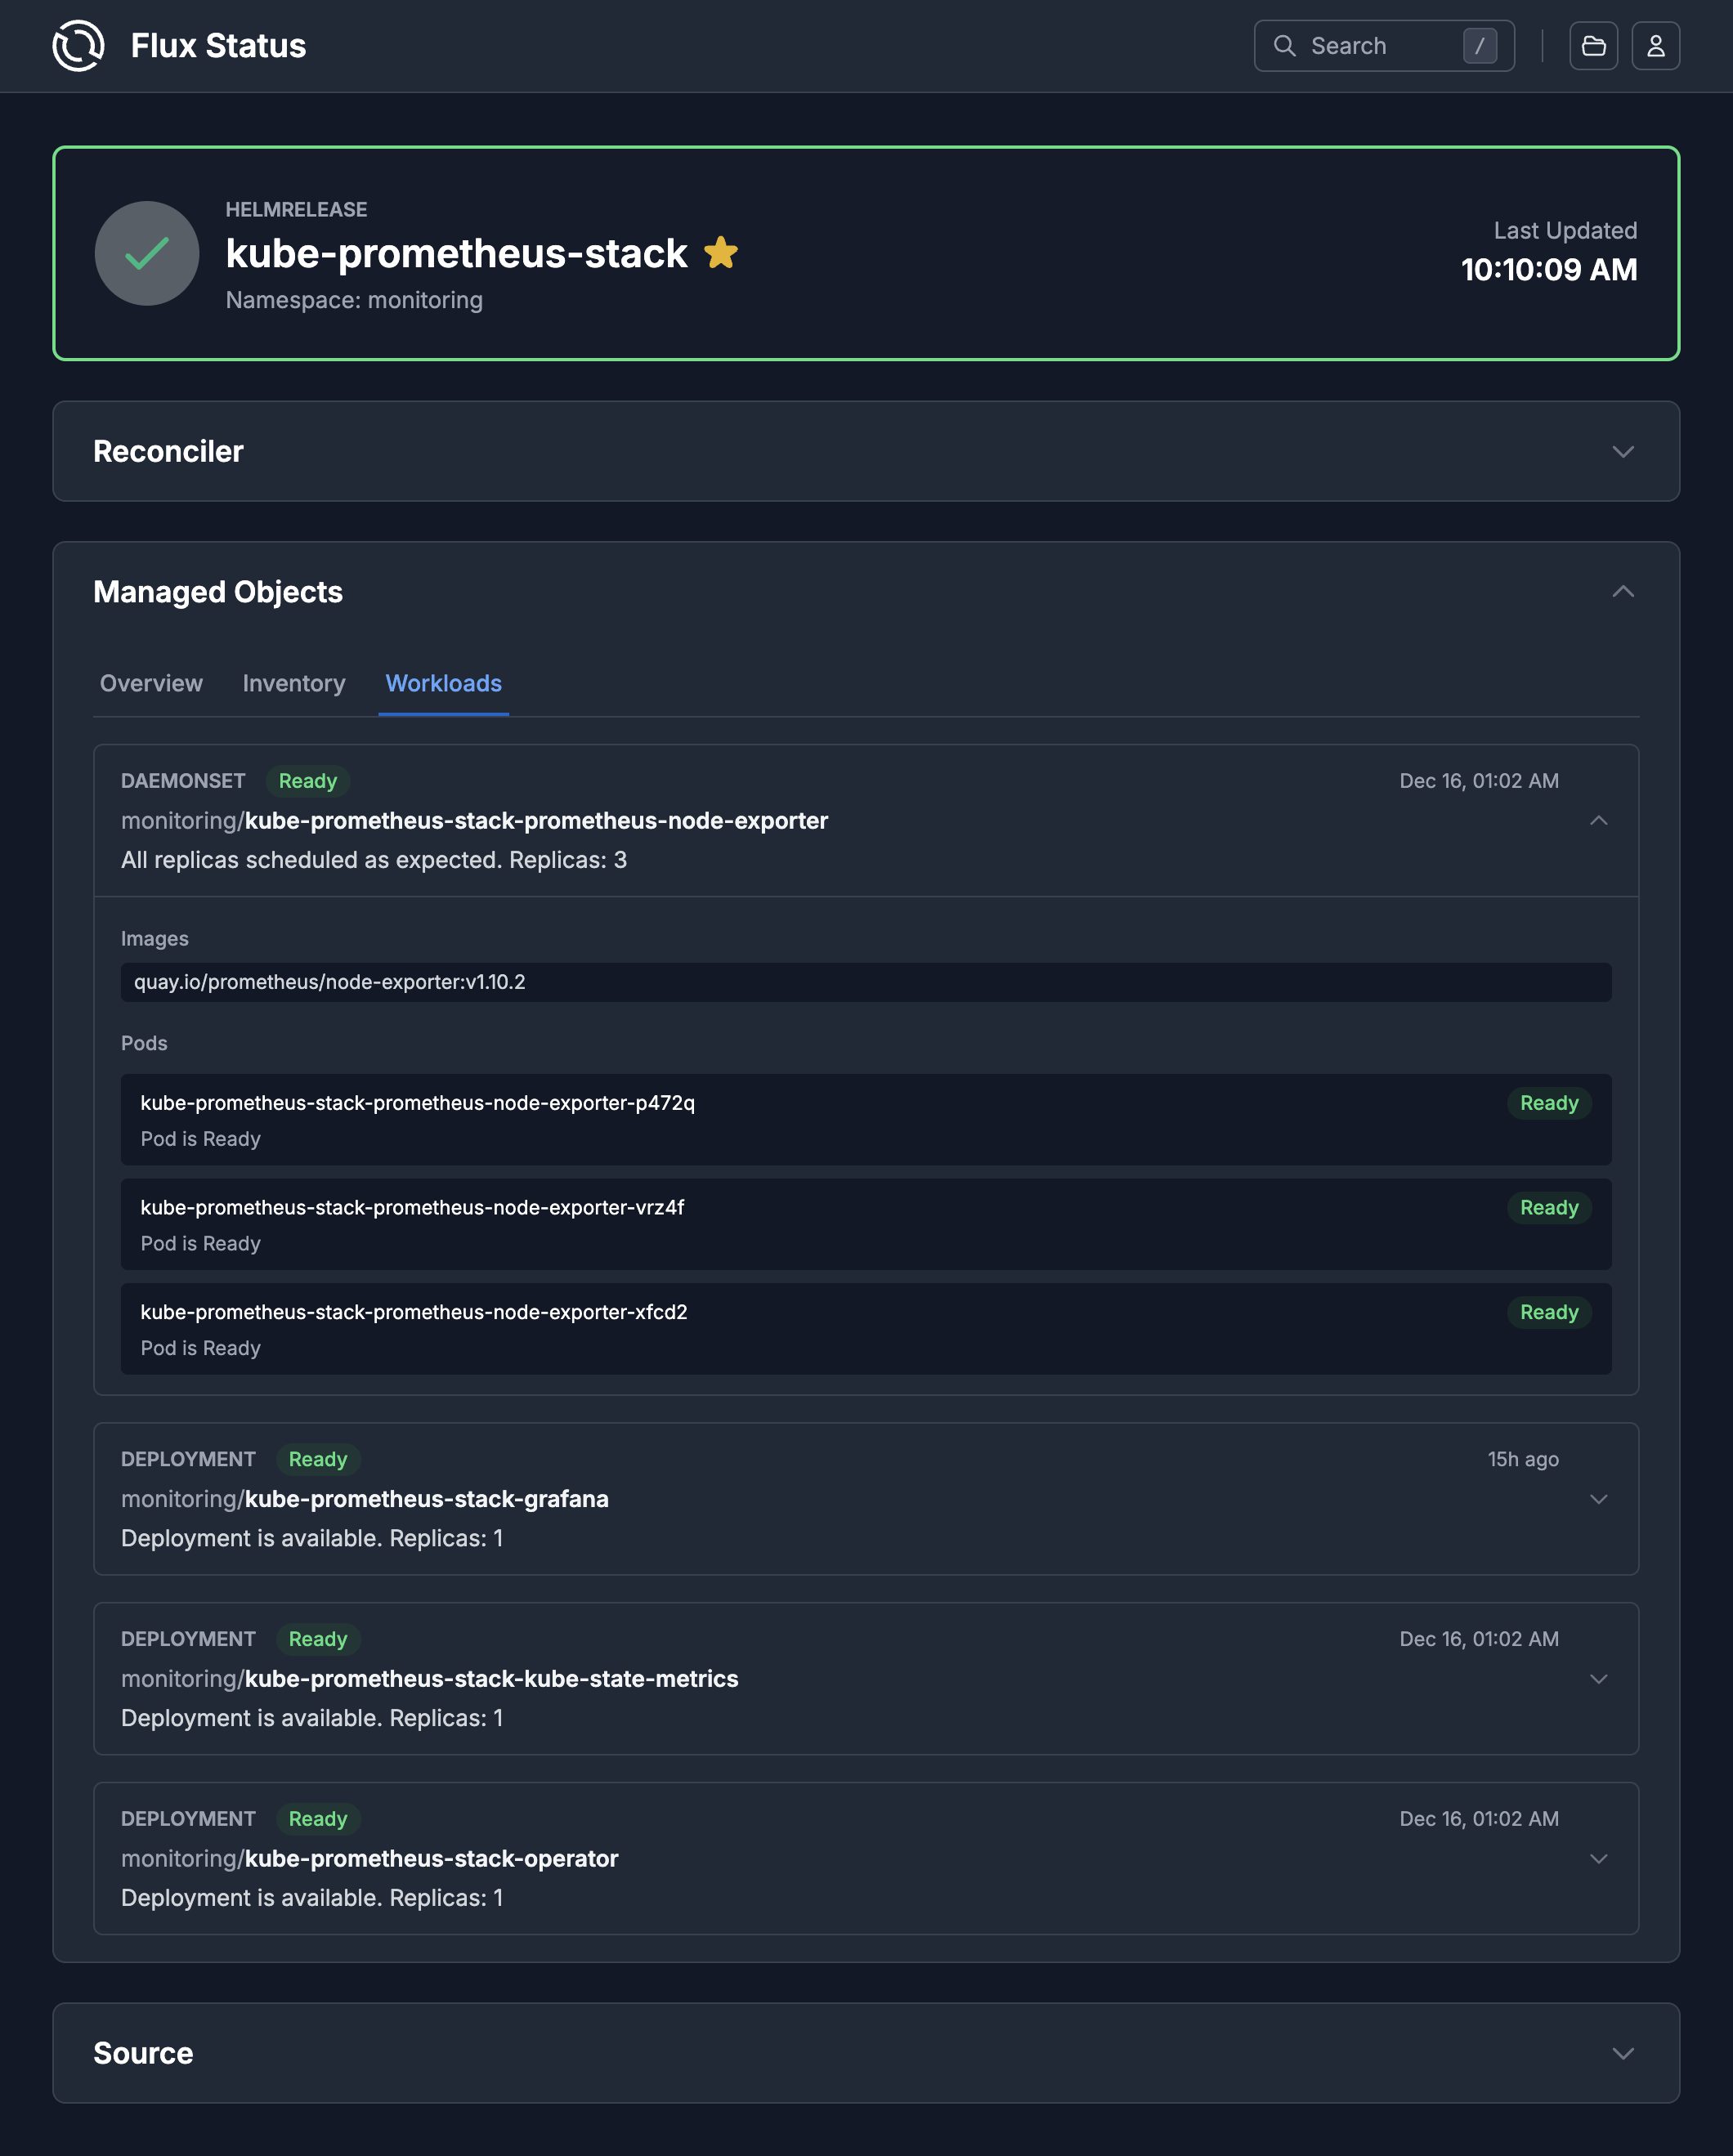
Workloads Overview
Monitor all workloads managed by Flux across your cluster. See deployment status, replica counts, and health indicators for every application in your GitOps pipeline.
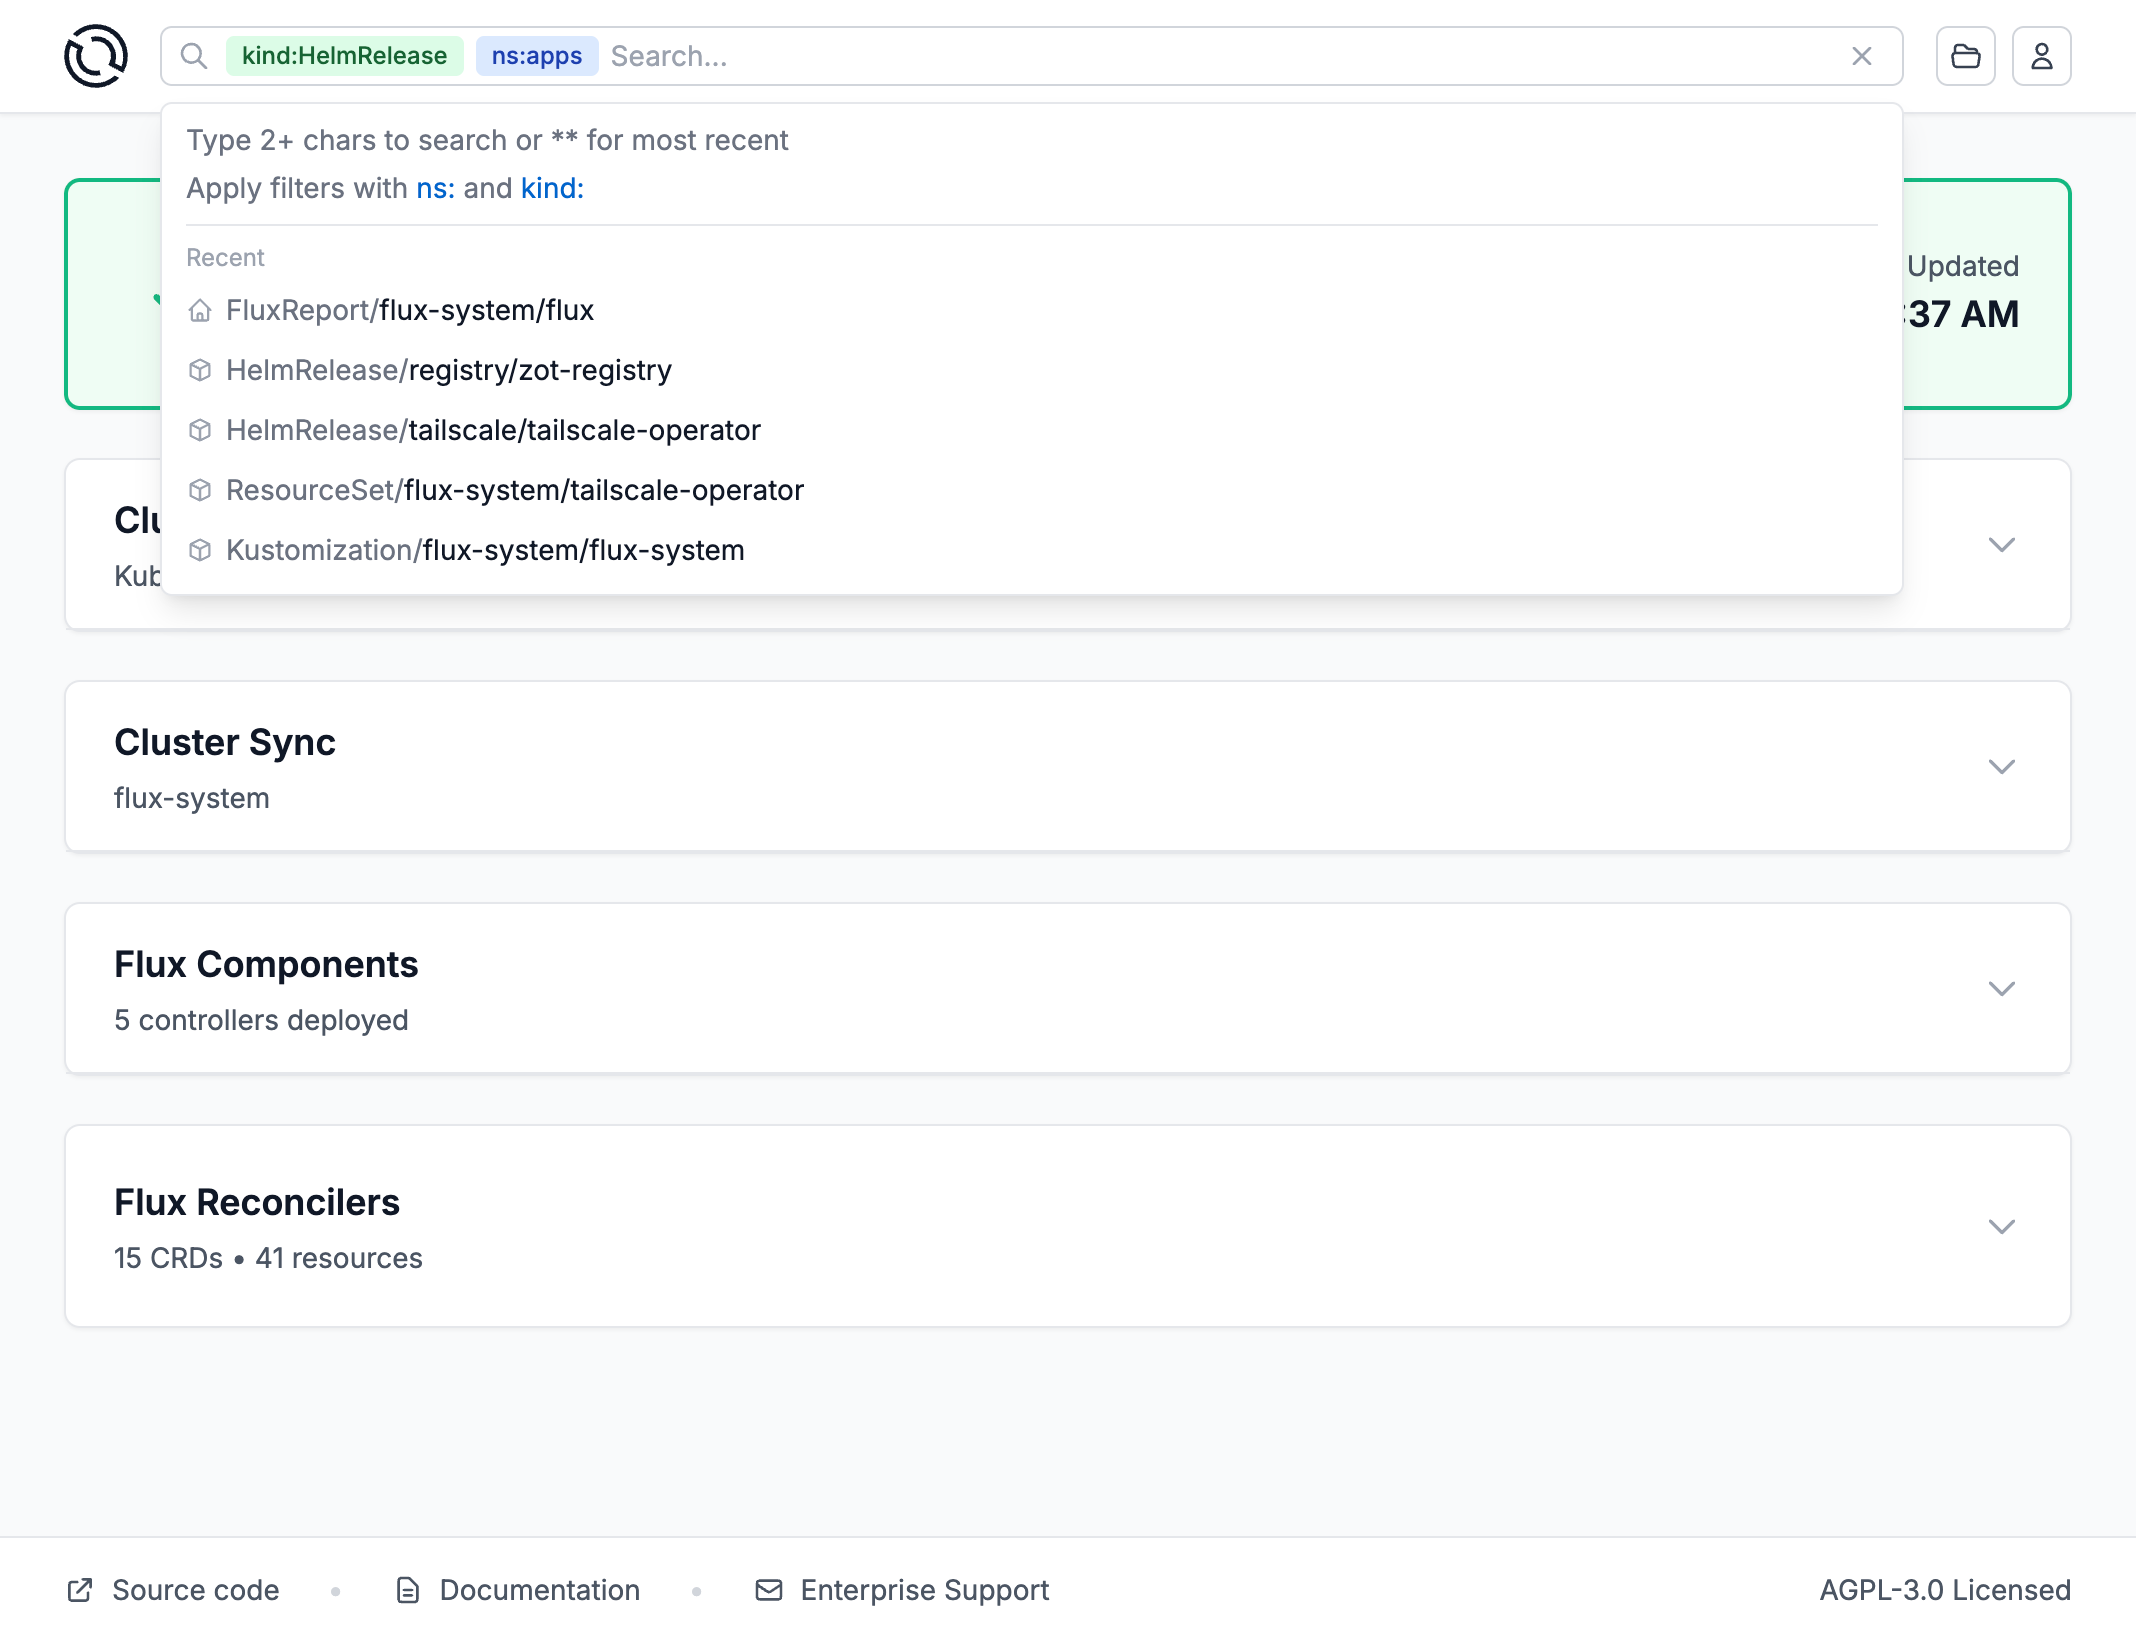
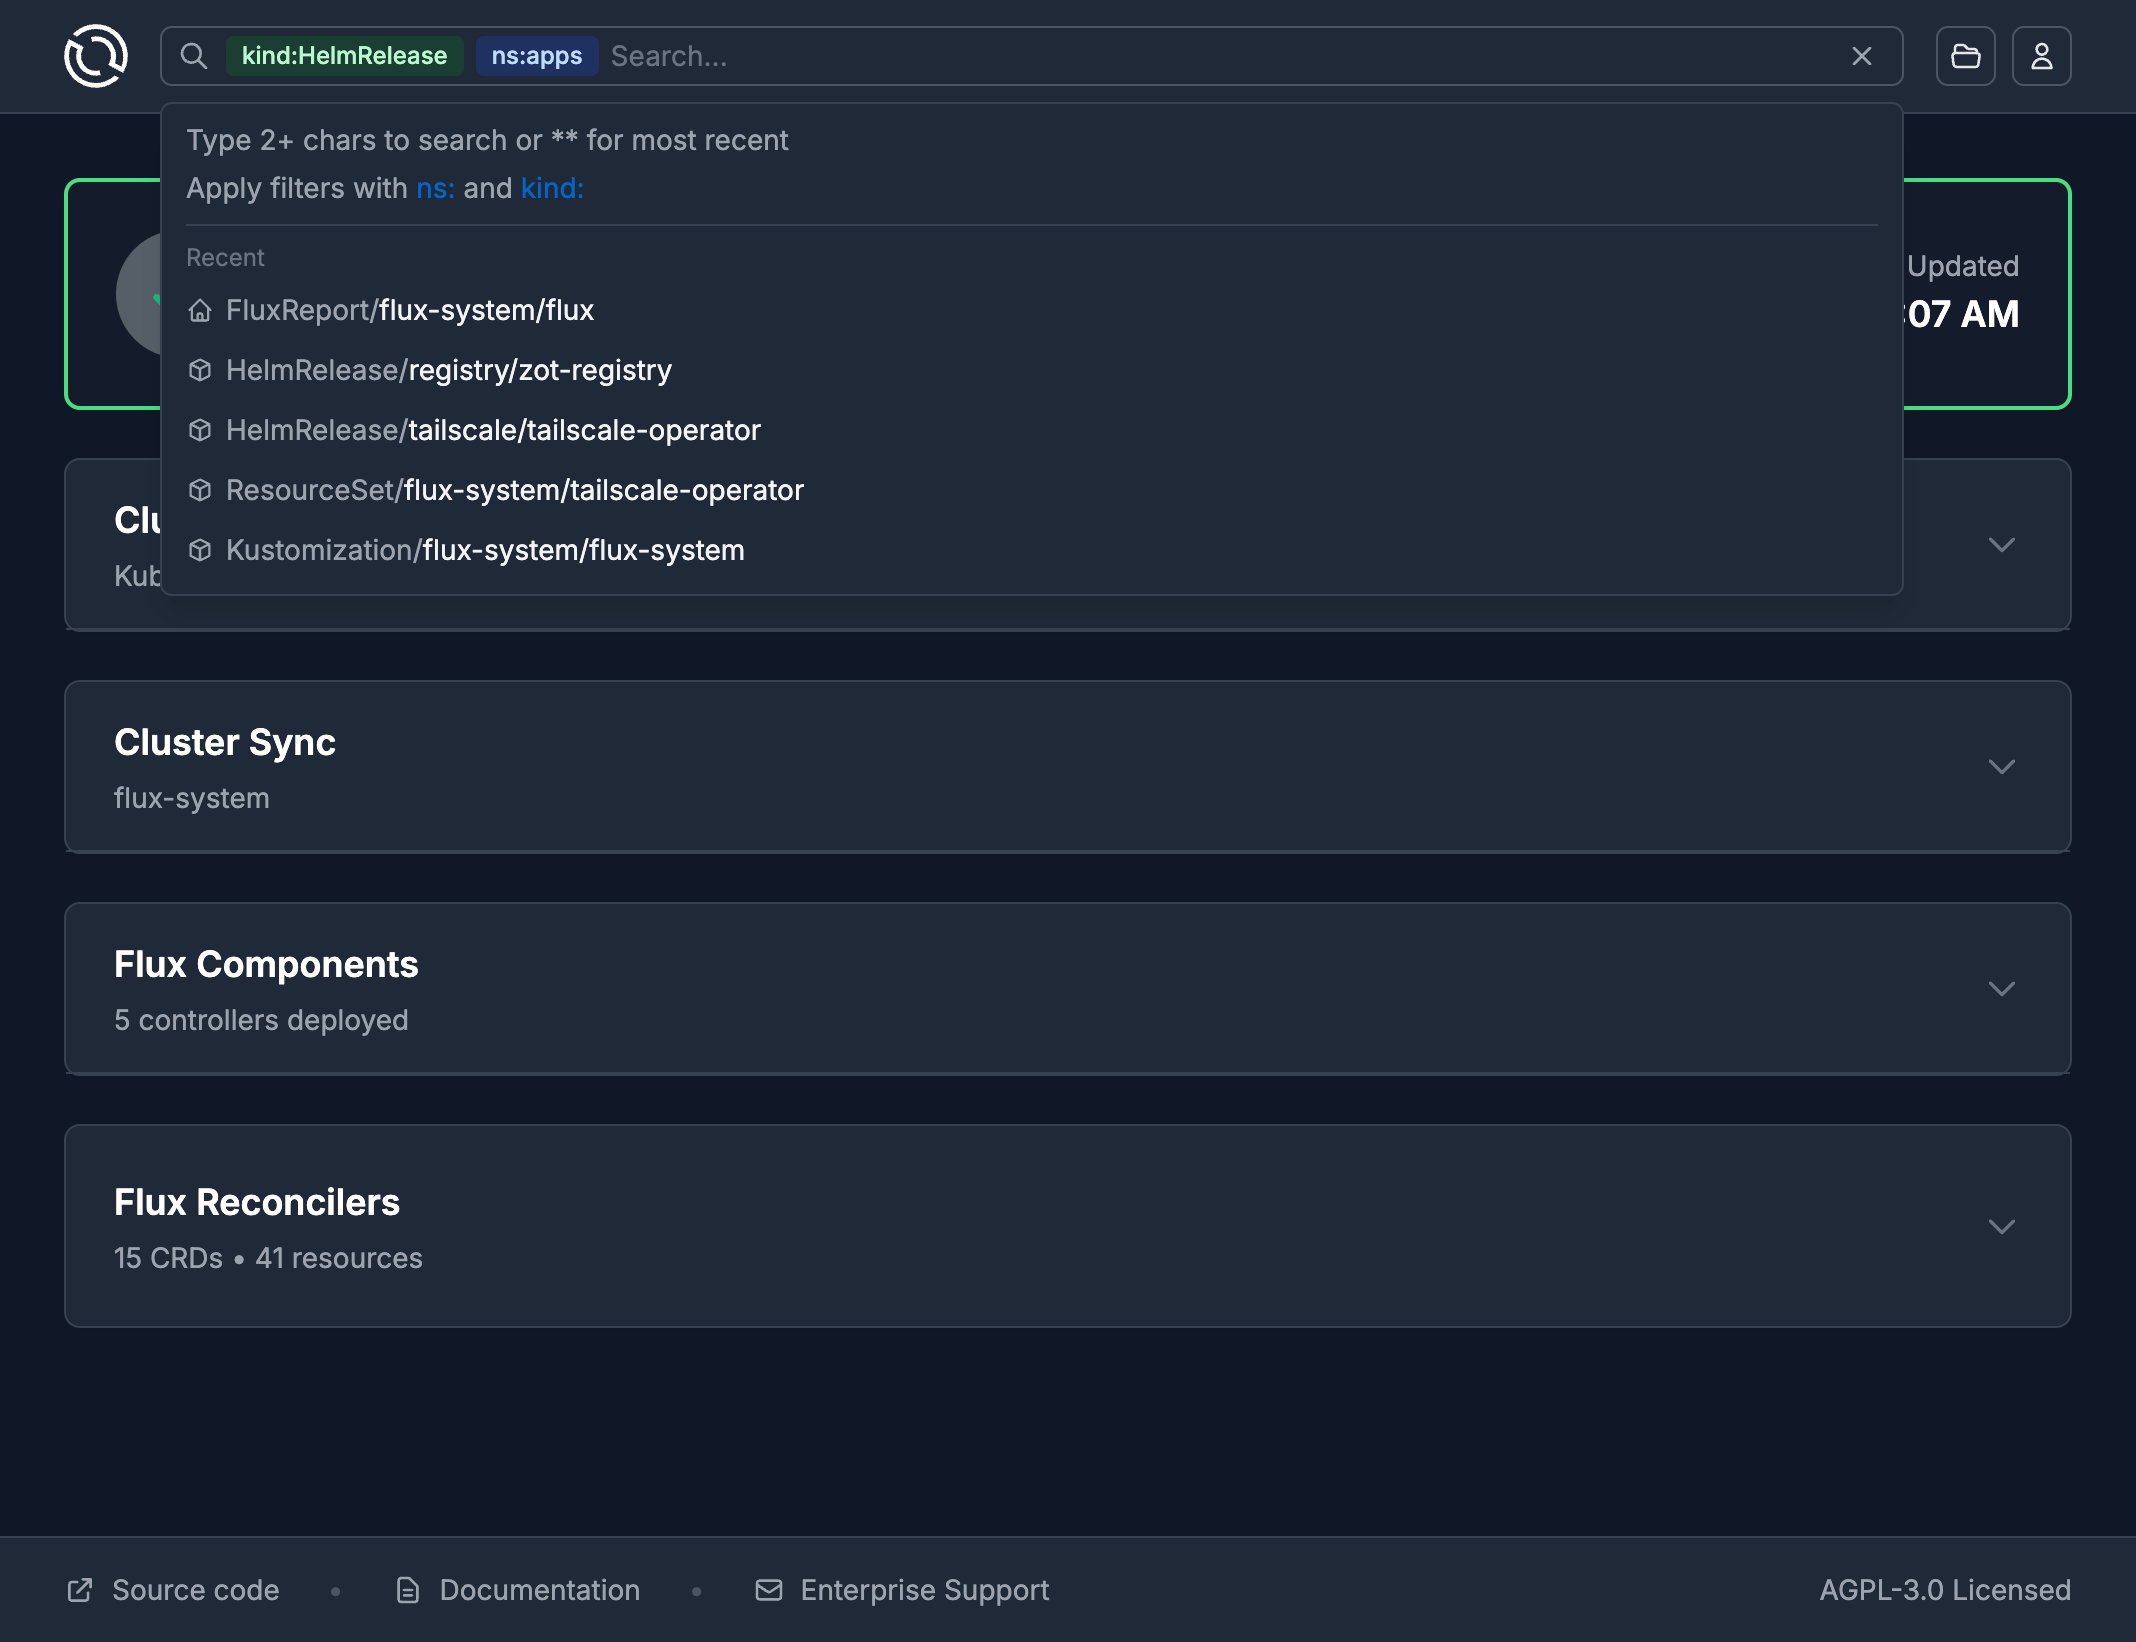
Powerful Search
Find any resource instantly with the advanced search functionality. Filter by type, namespace, status, or name to quickly locate specific Kustomizations, HelmReleases, or source repositories.
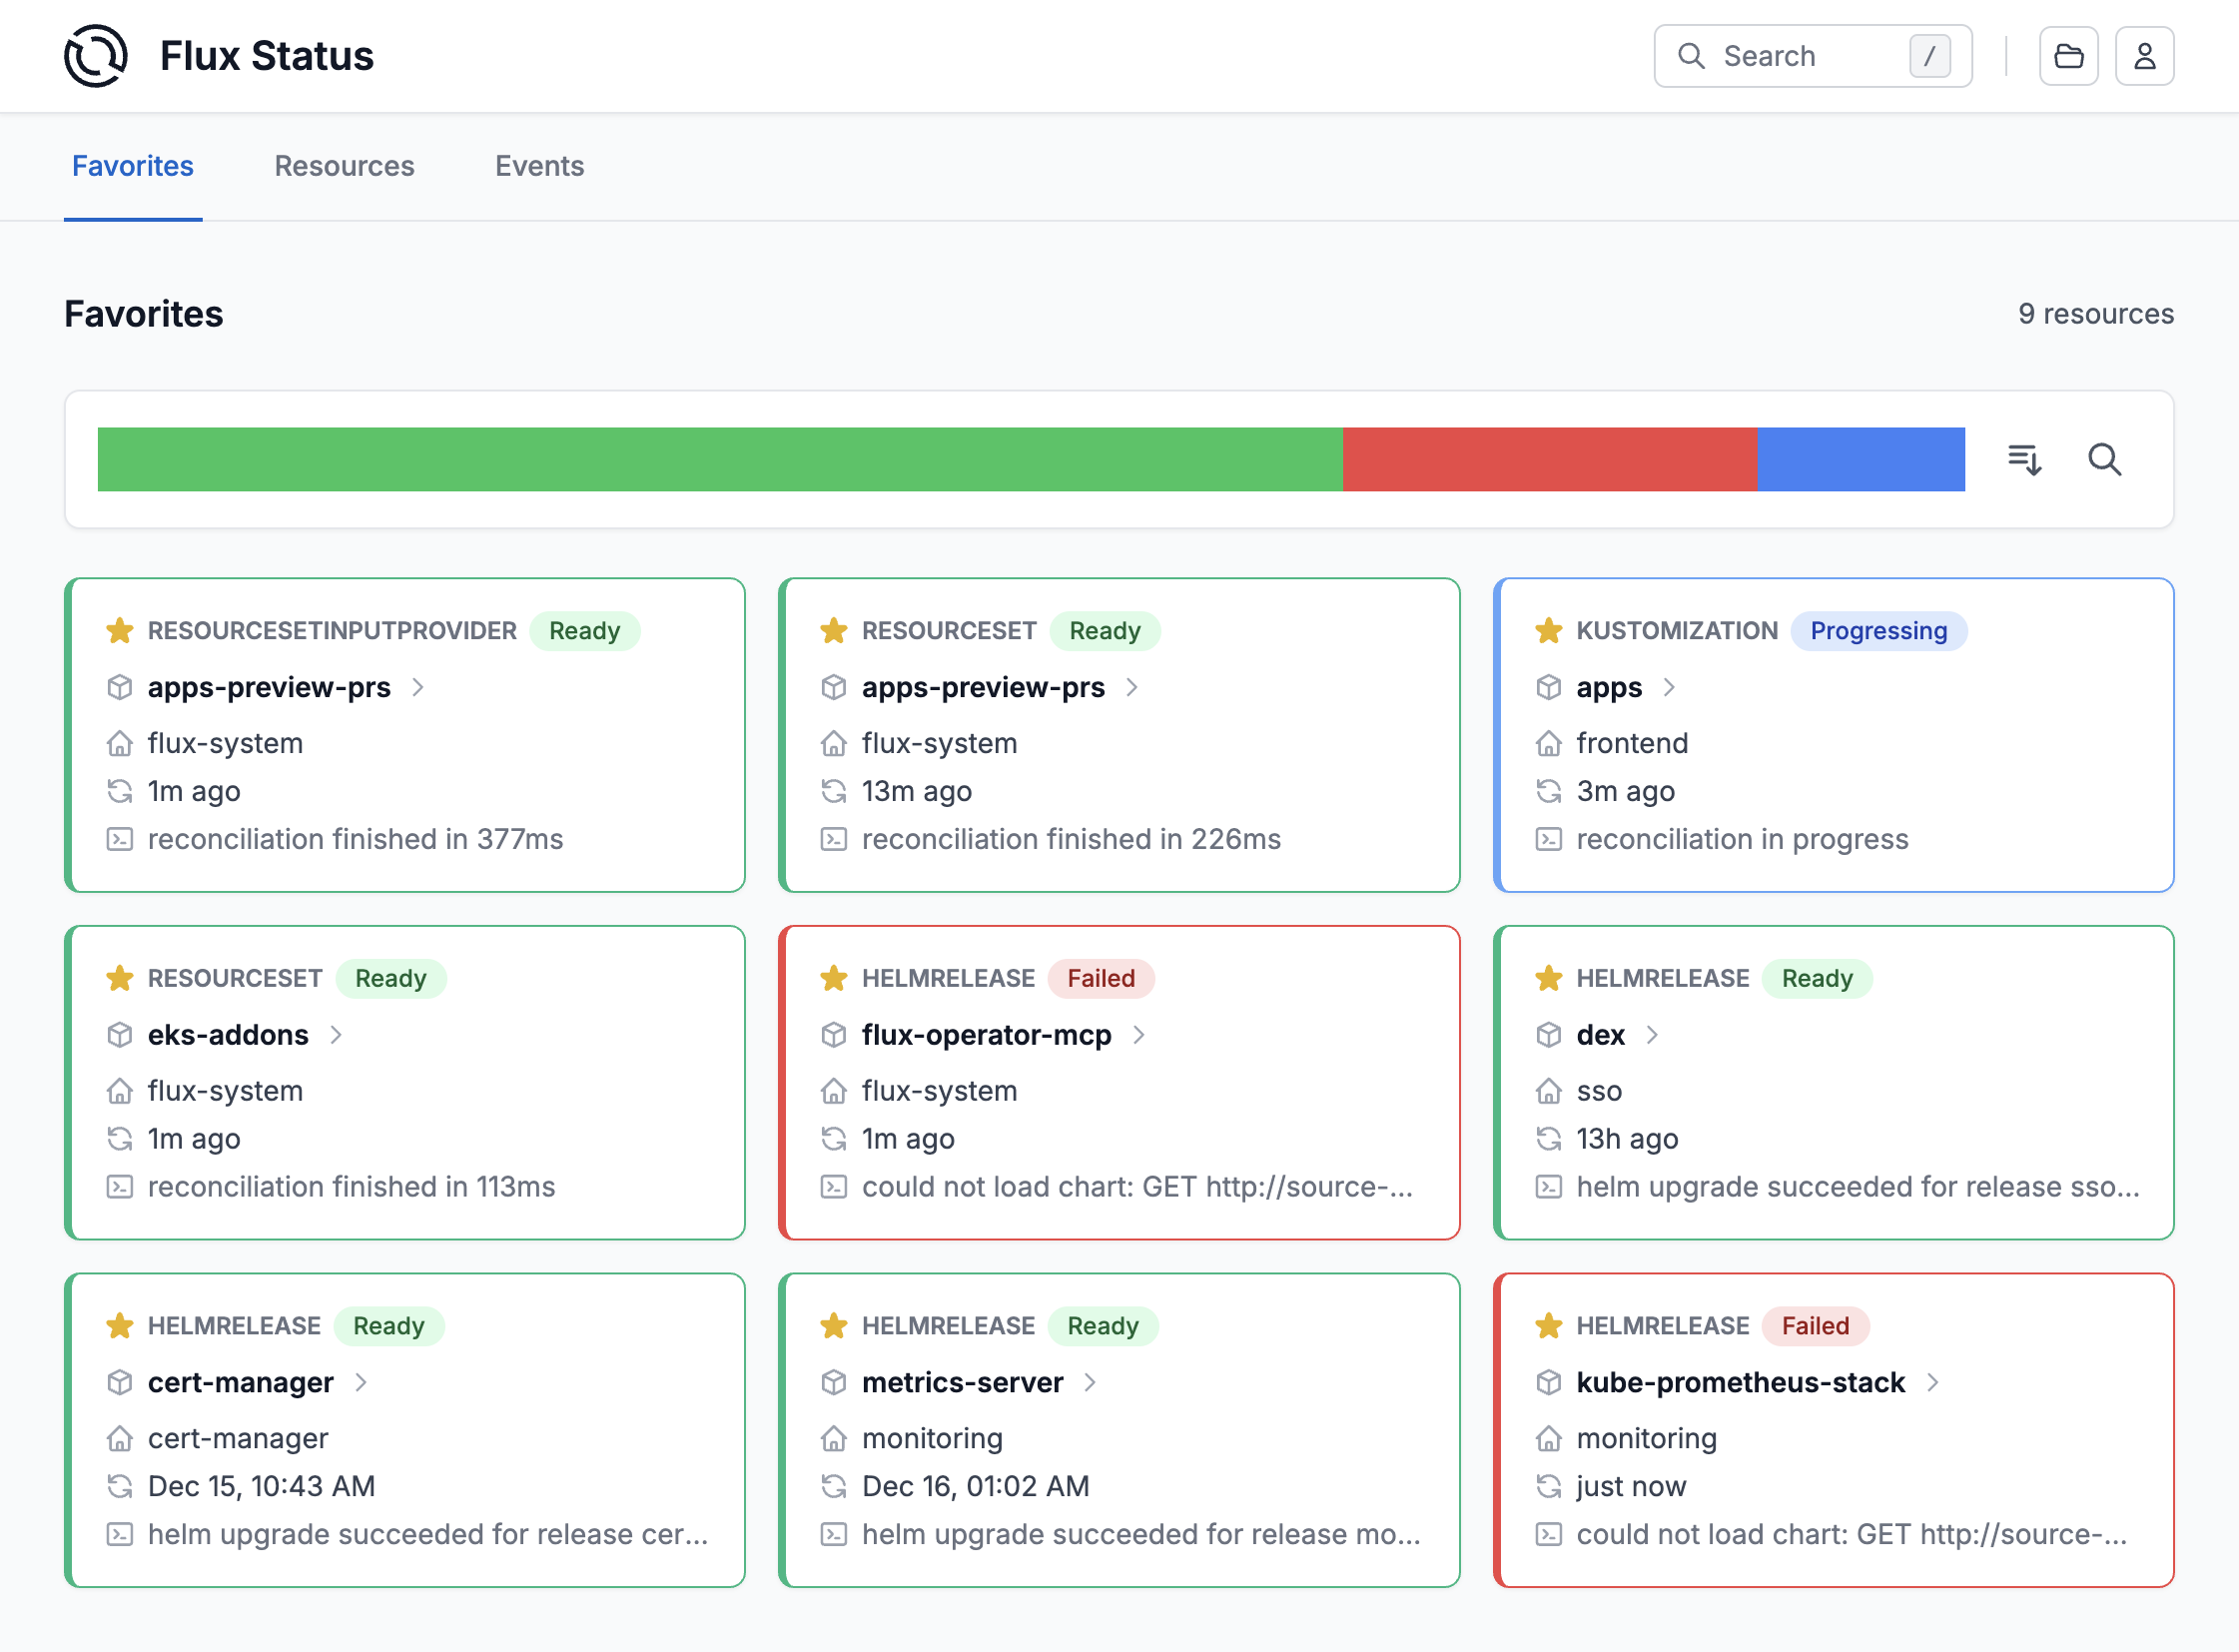
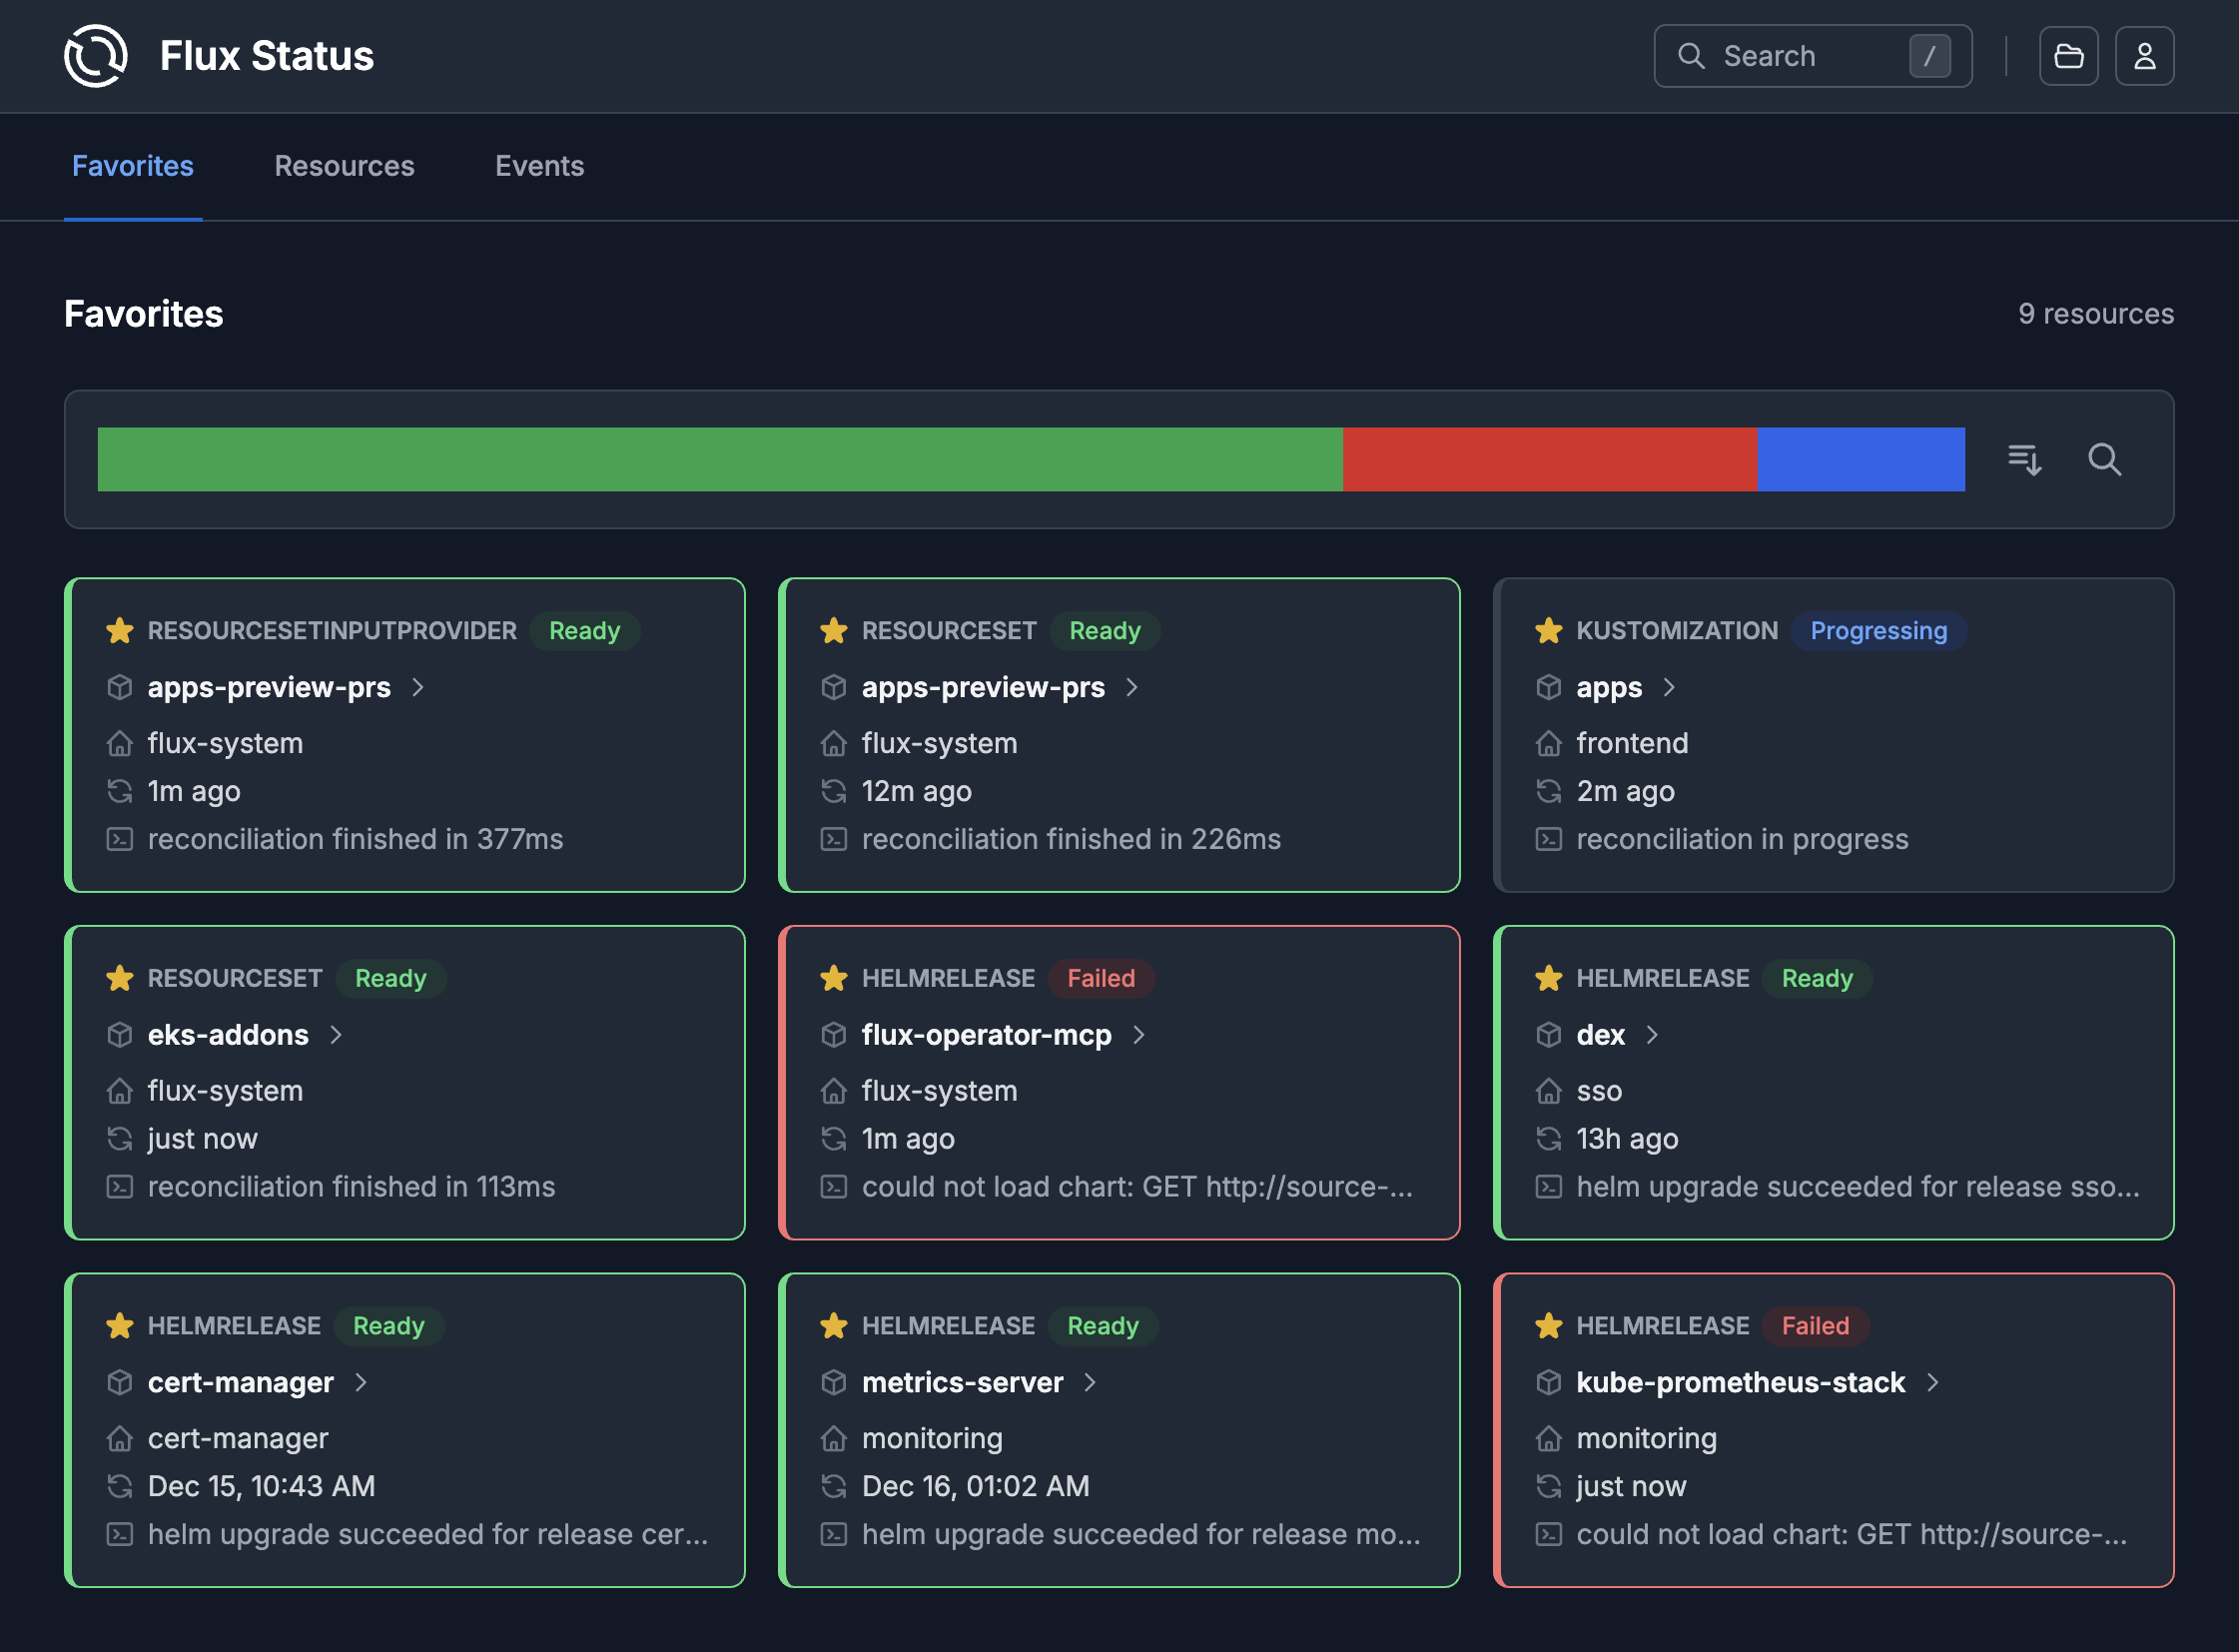
Favorites
Pin your most important resources for quick access. The favorites view provides an at-a-glance status of the resources you care about most, perfect for monitoring critical production deployments.
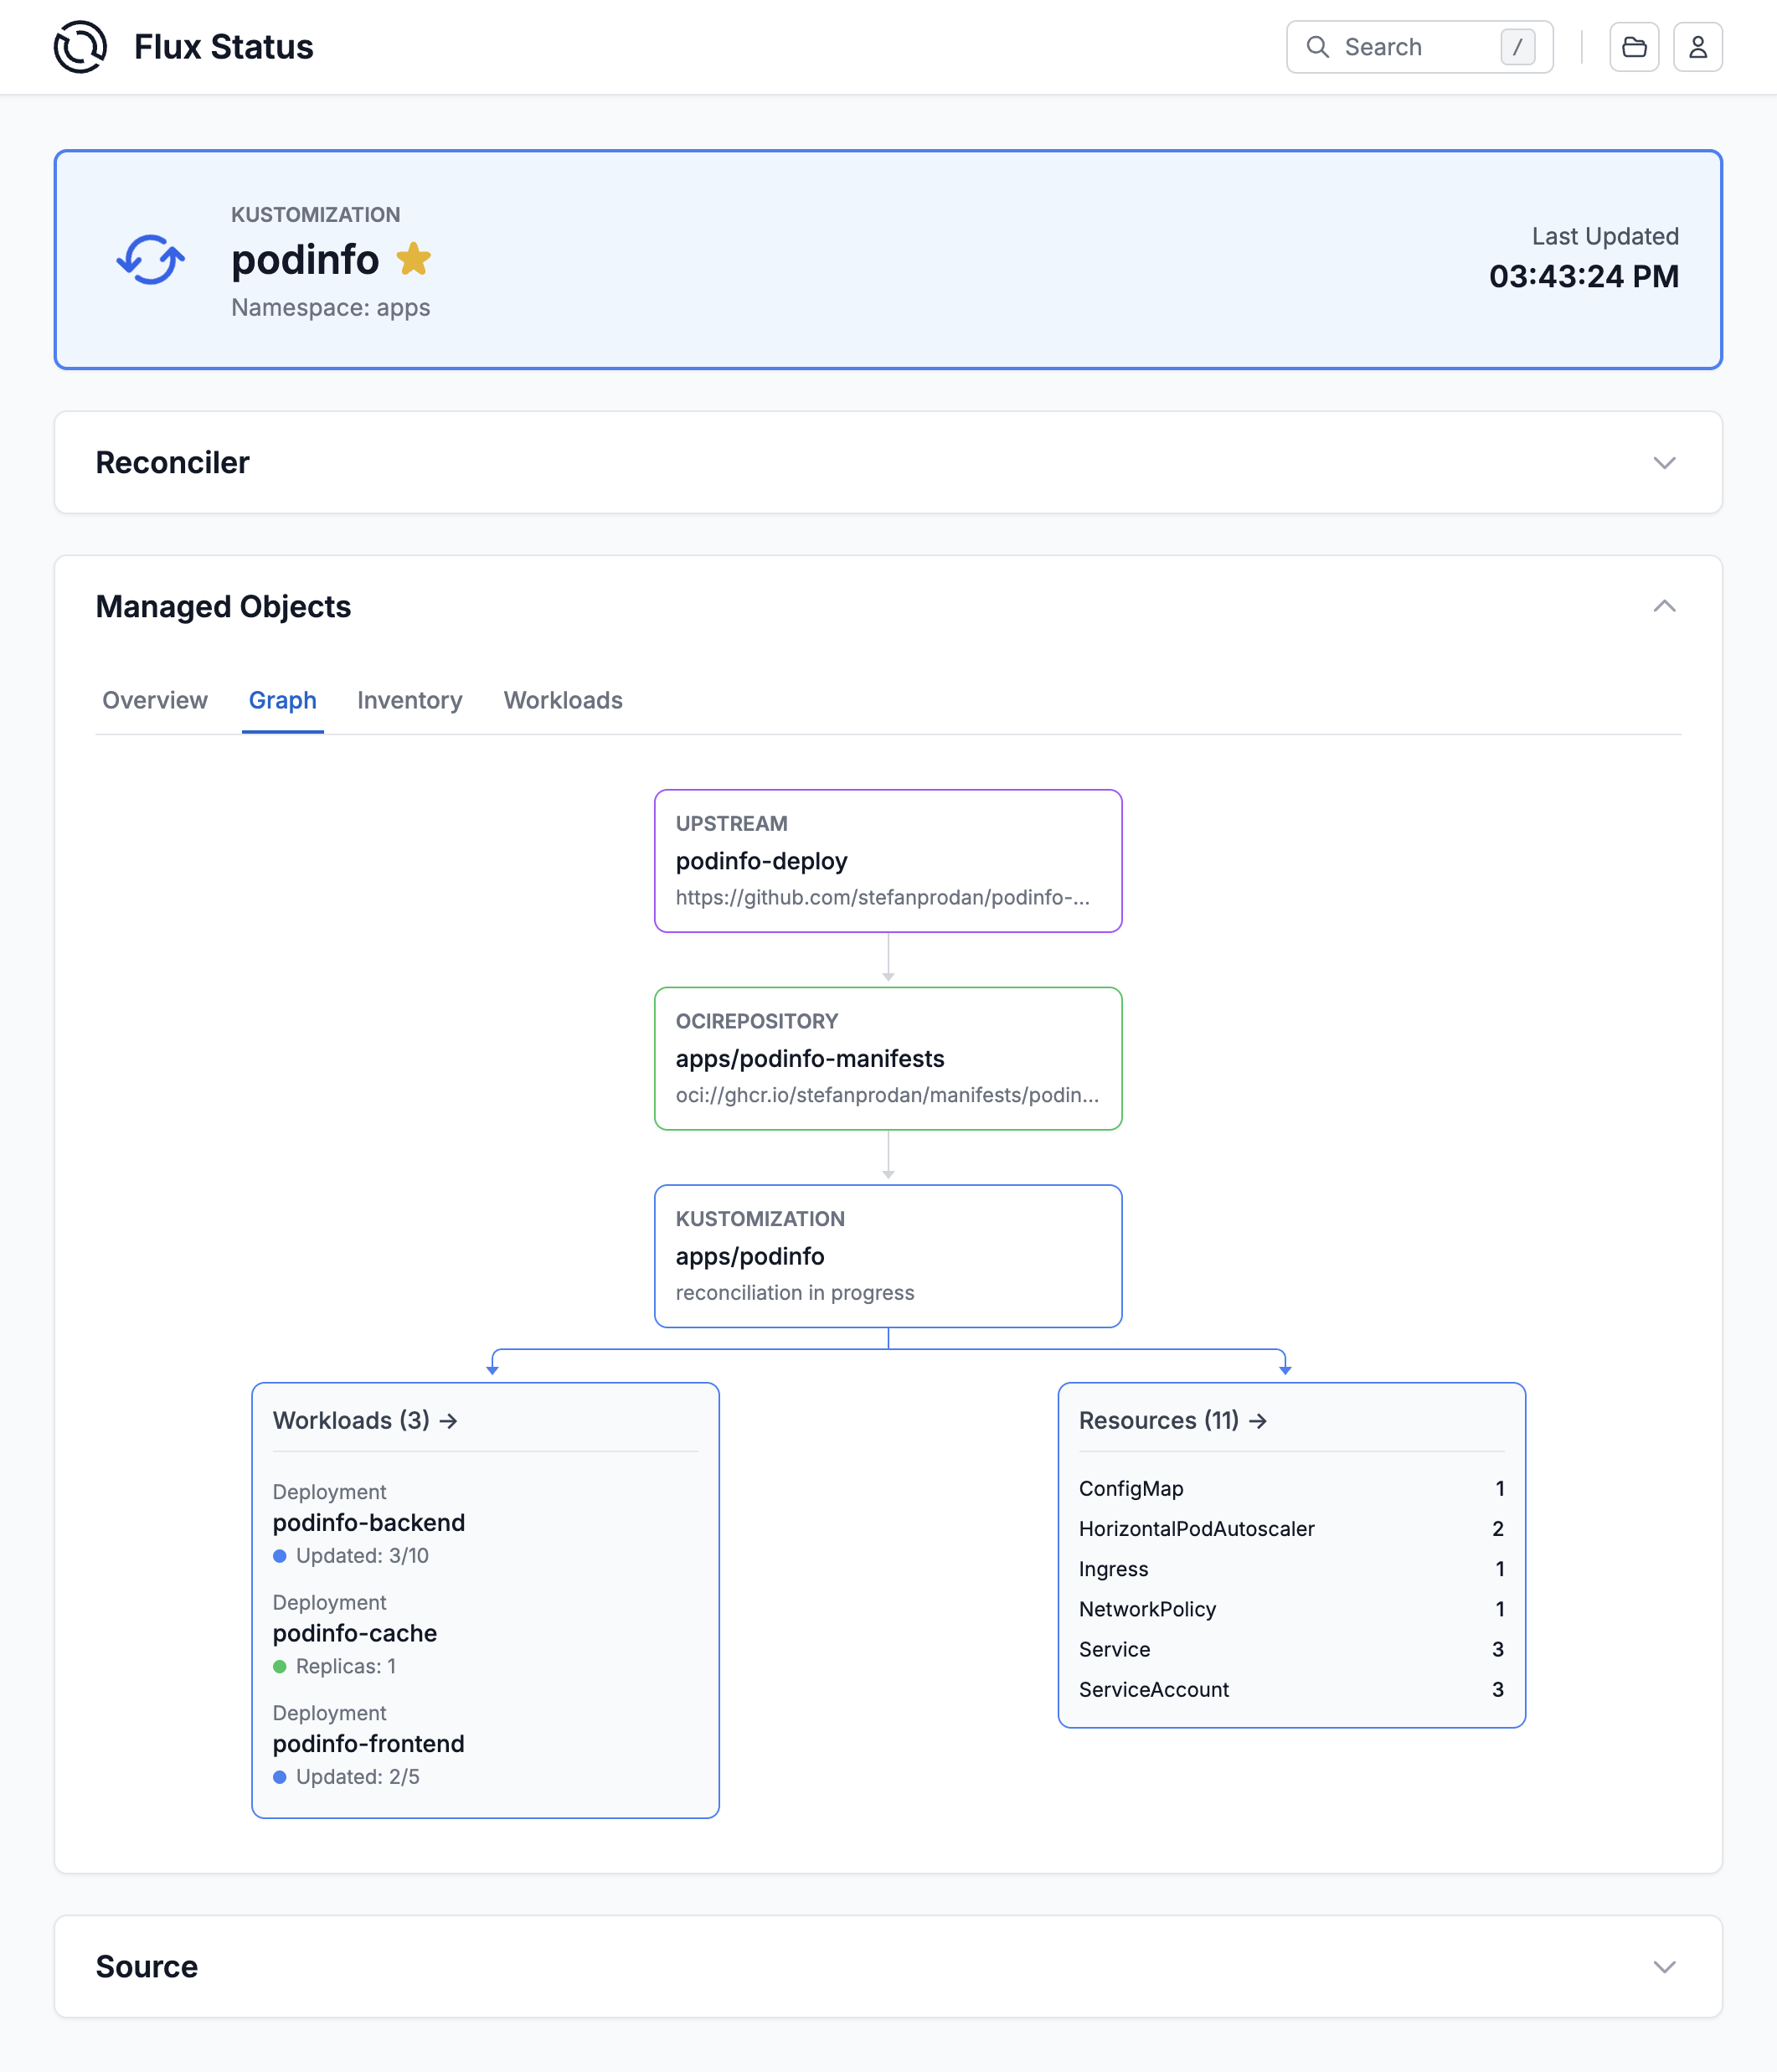
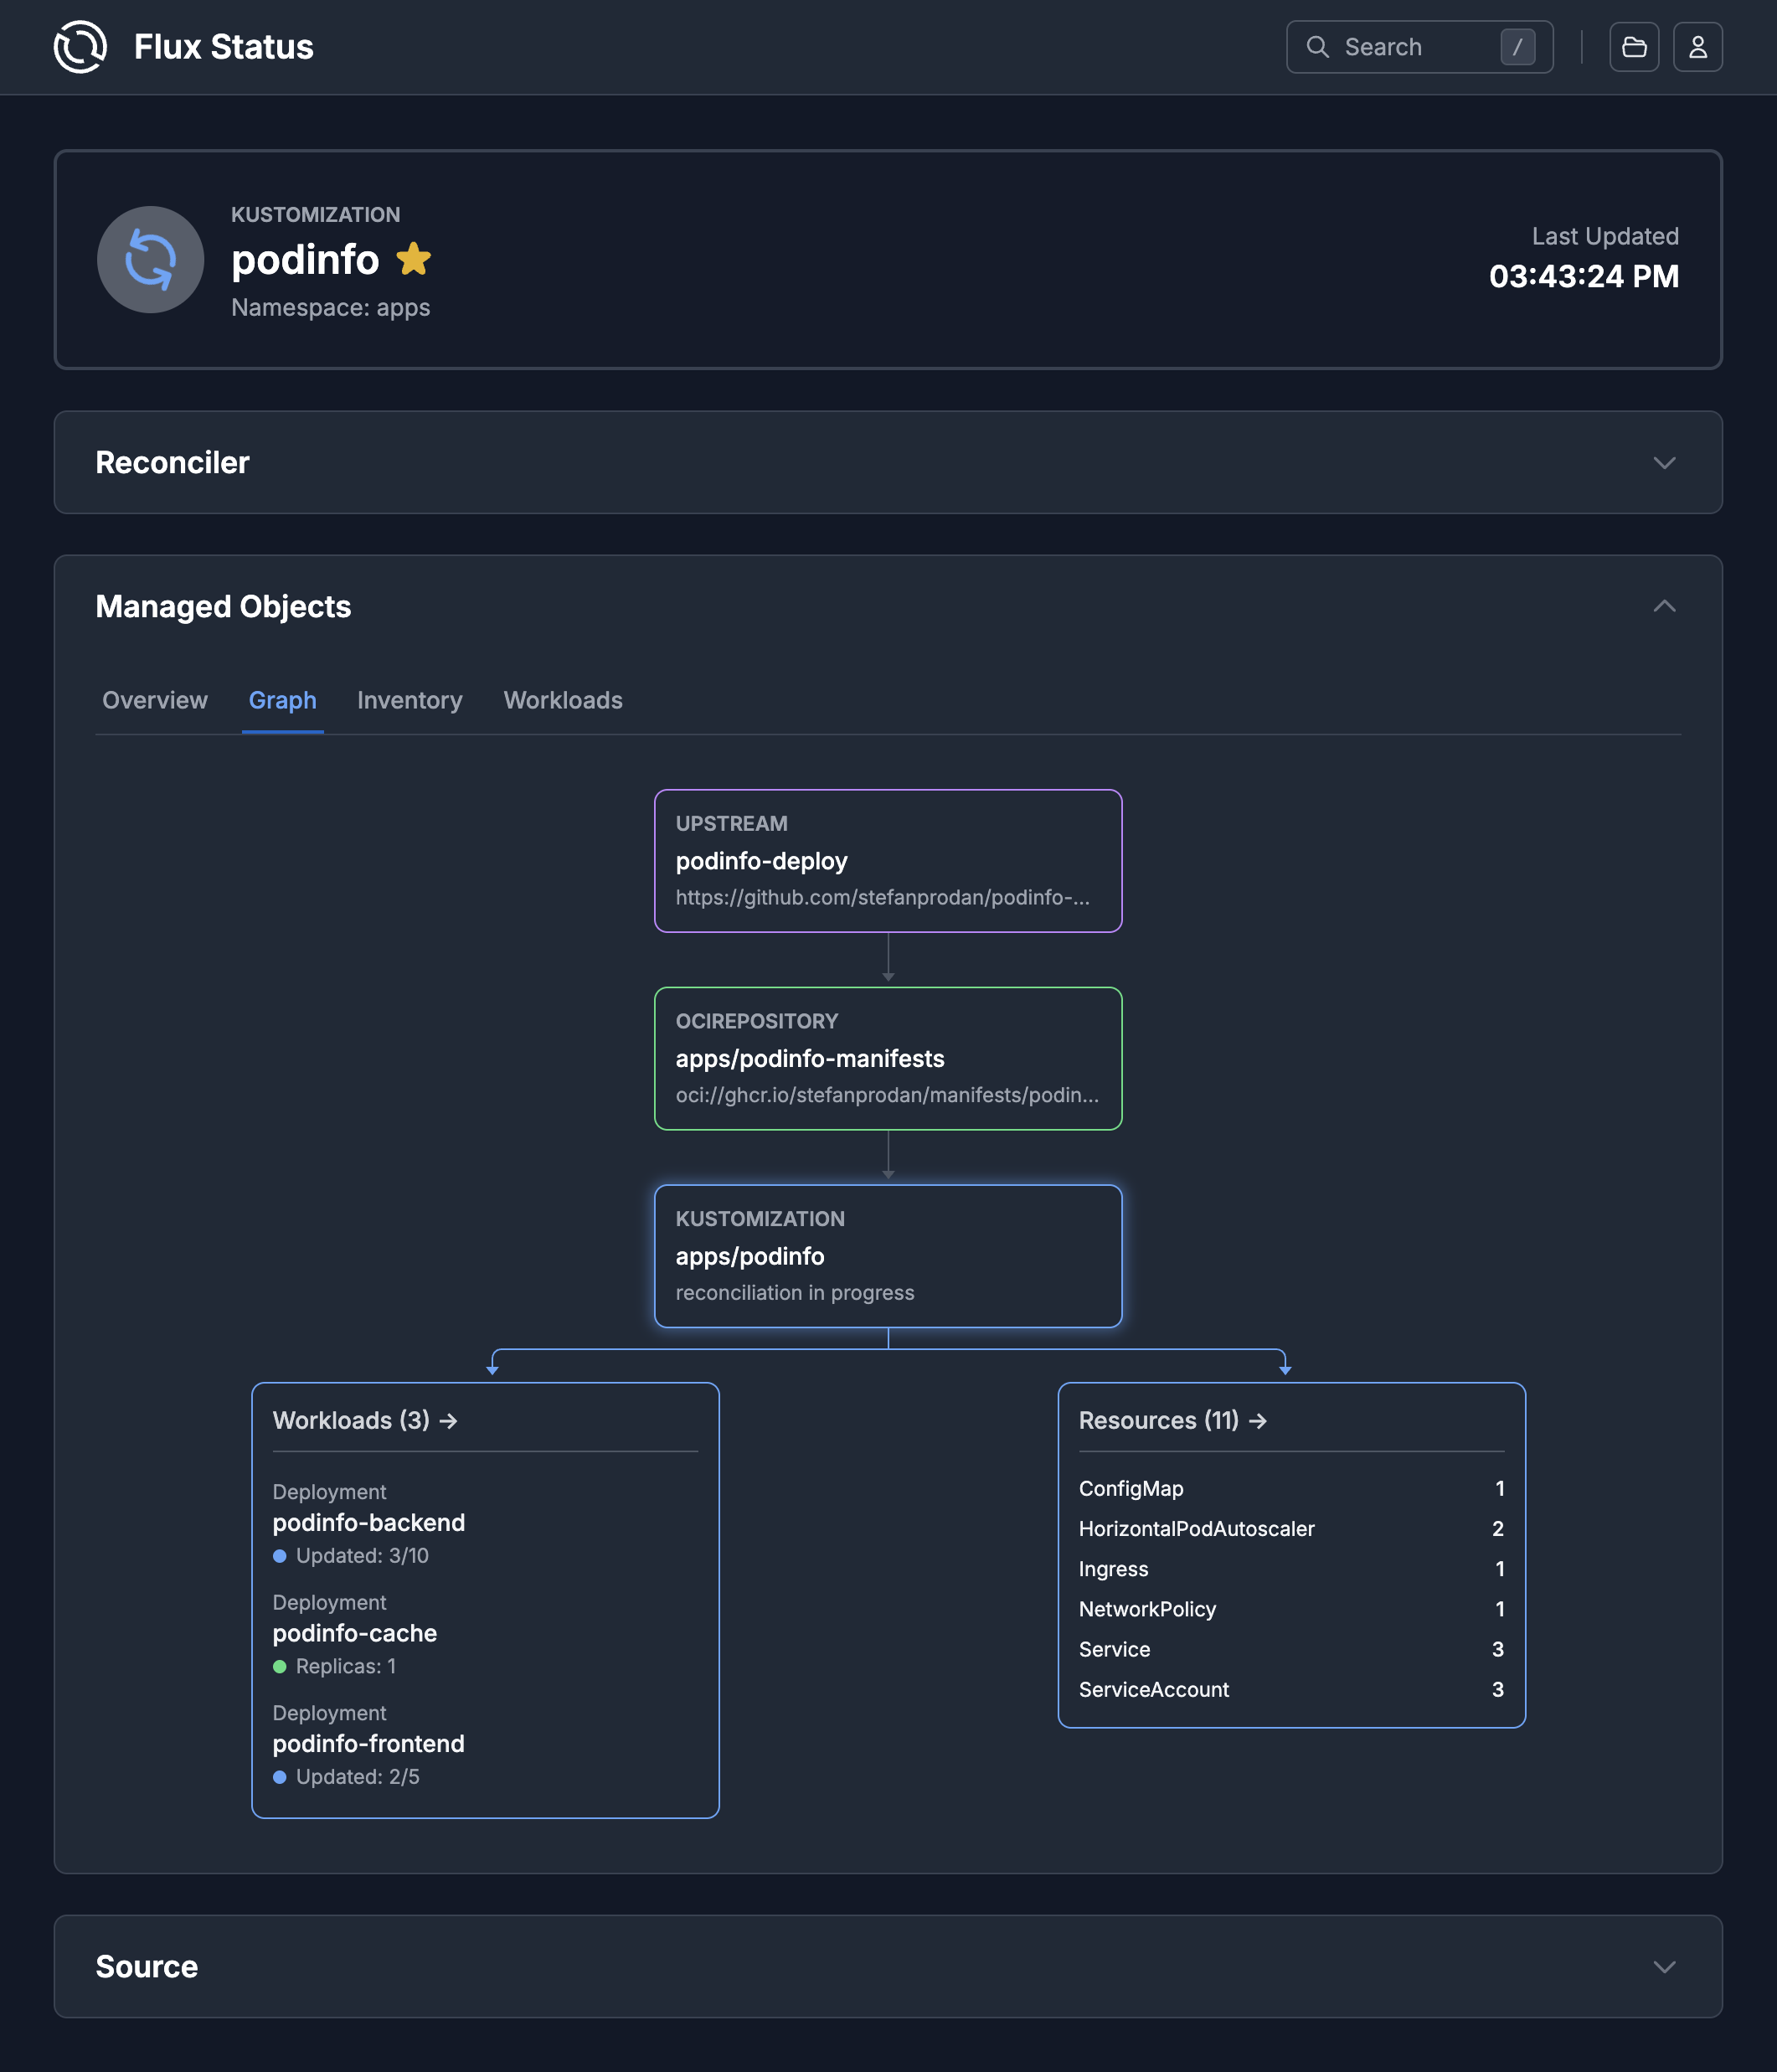
GitOps Graph
Visualize your app delivery pipeline in an interactive graph. See real-time status updates as resources reconcile, trace dependencies from sources to deployments, and instantly spot issues as they occur.
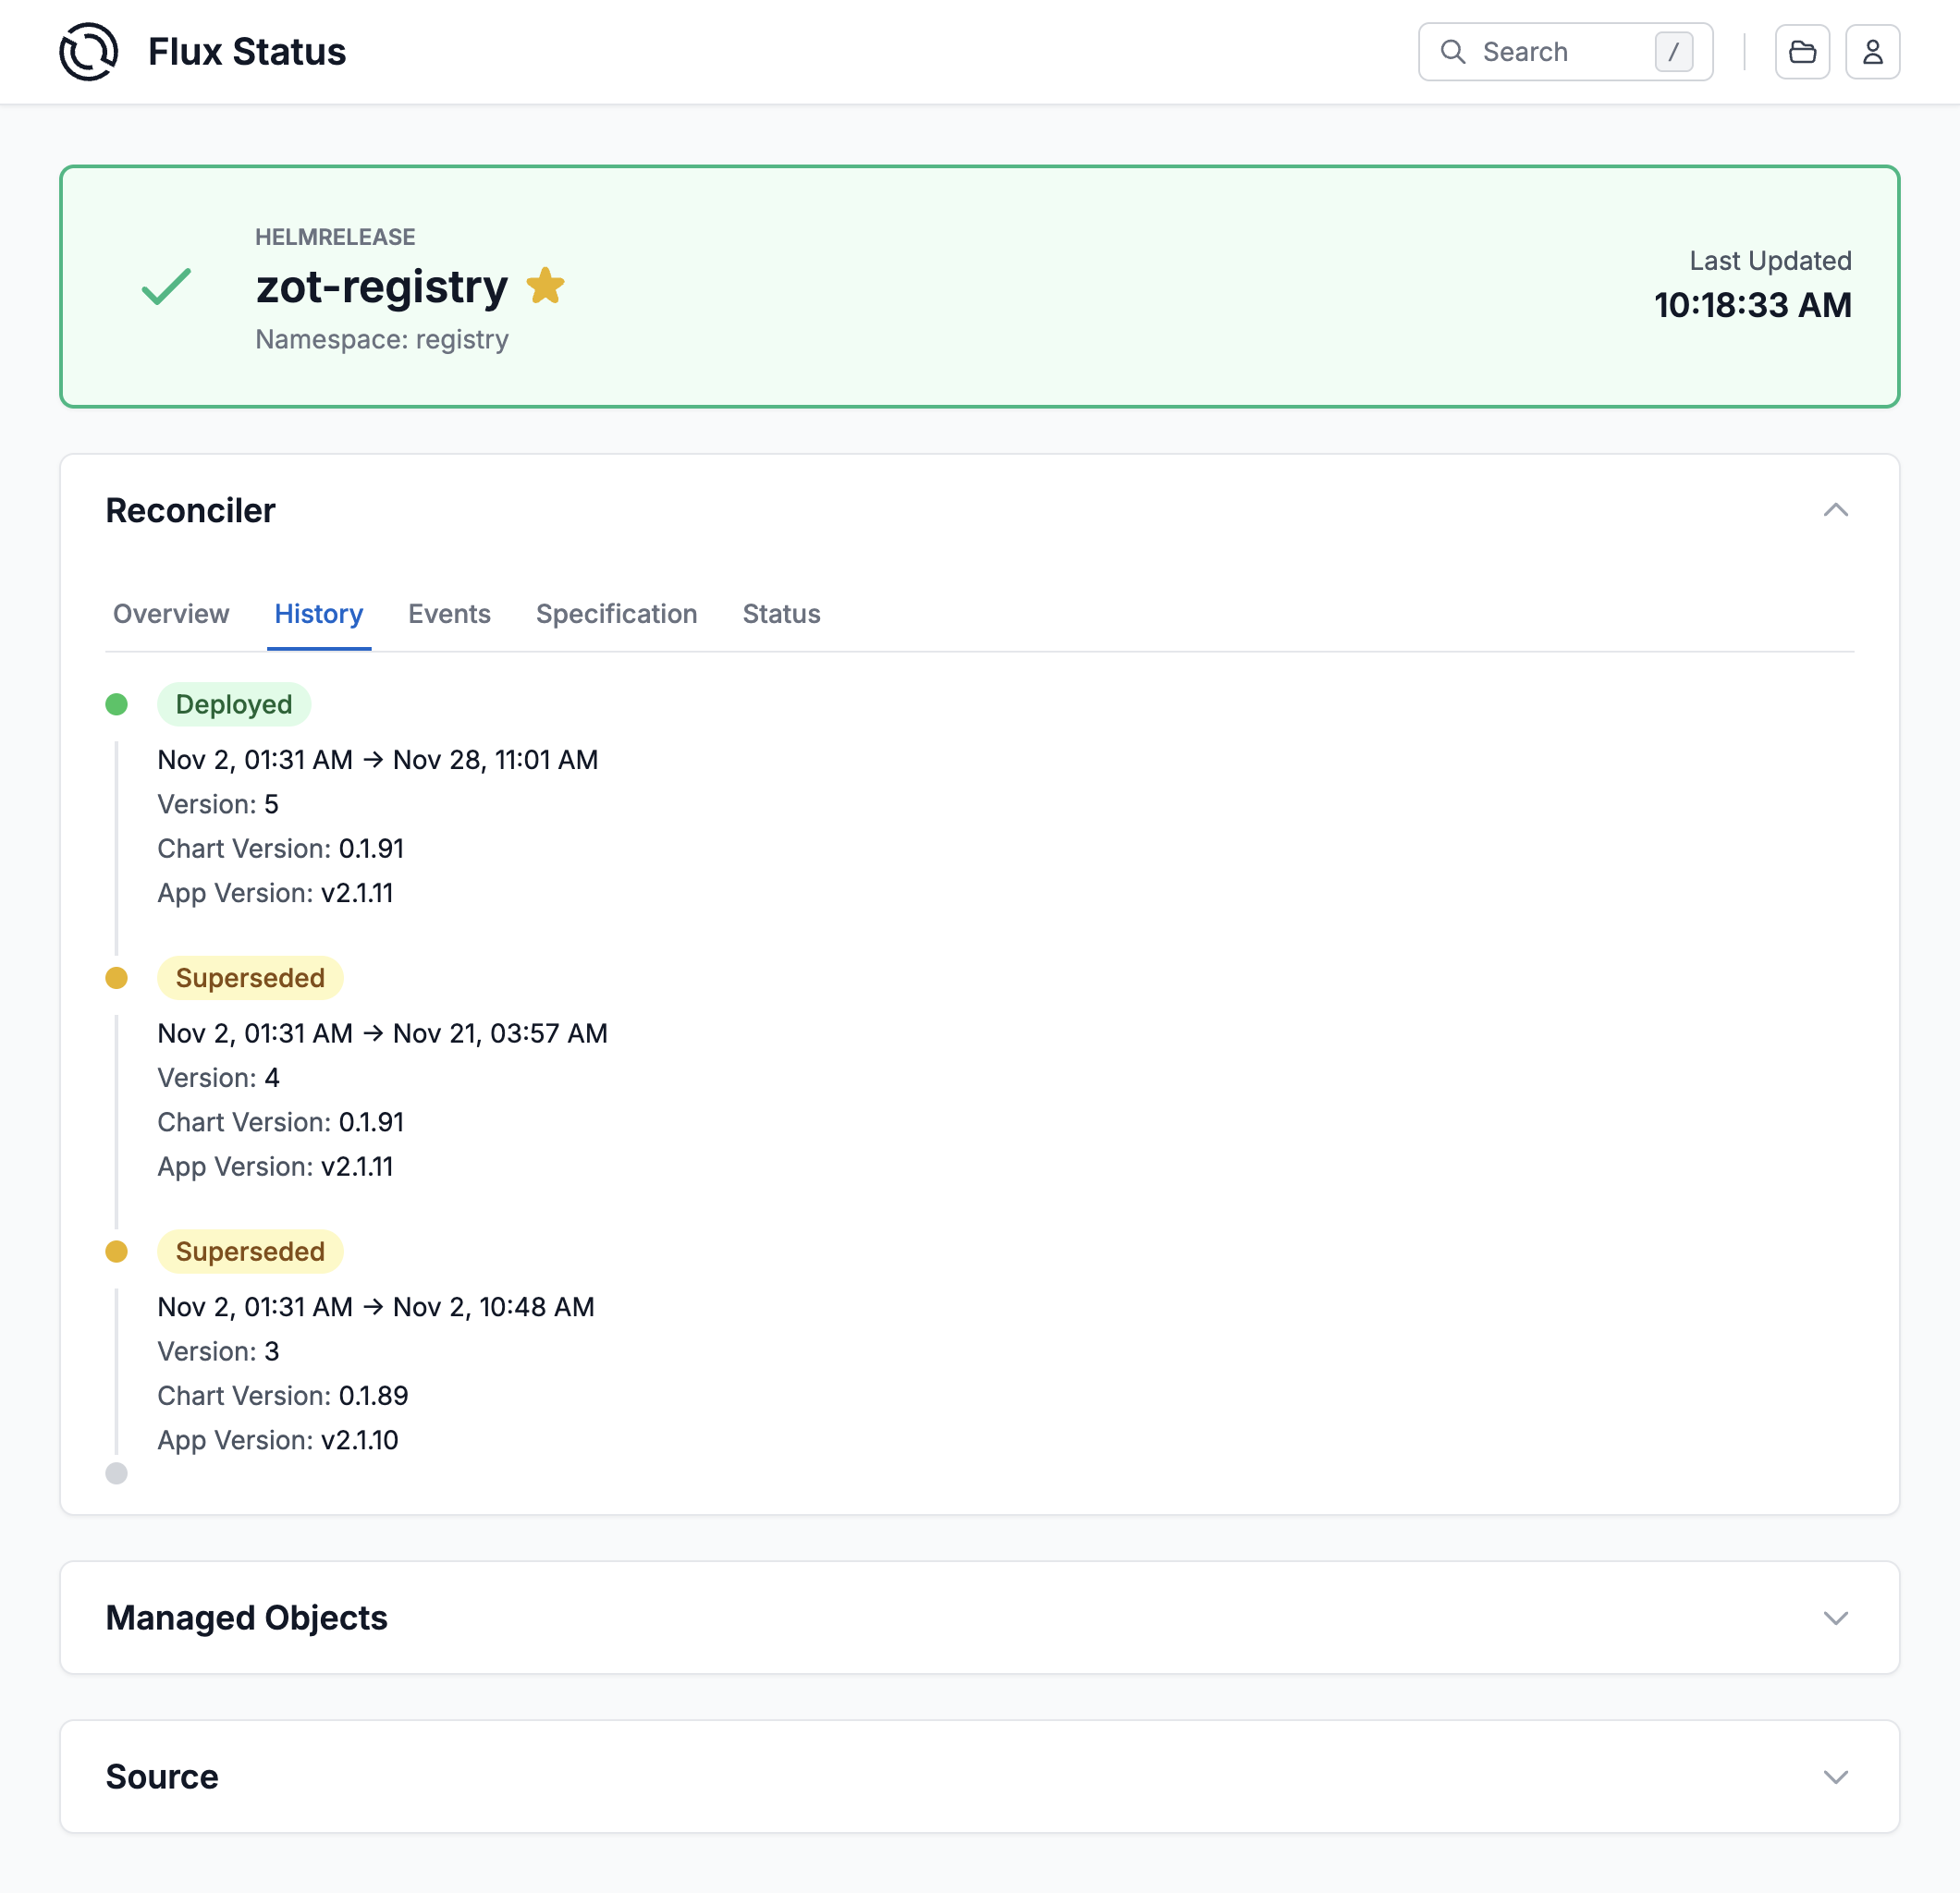
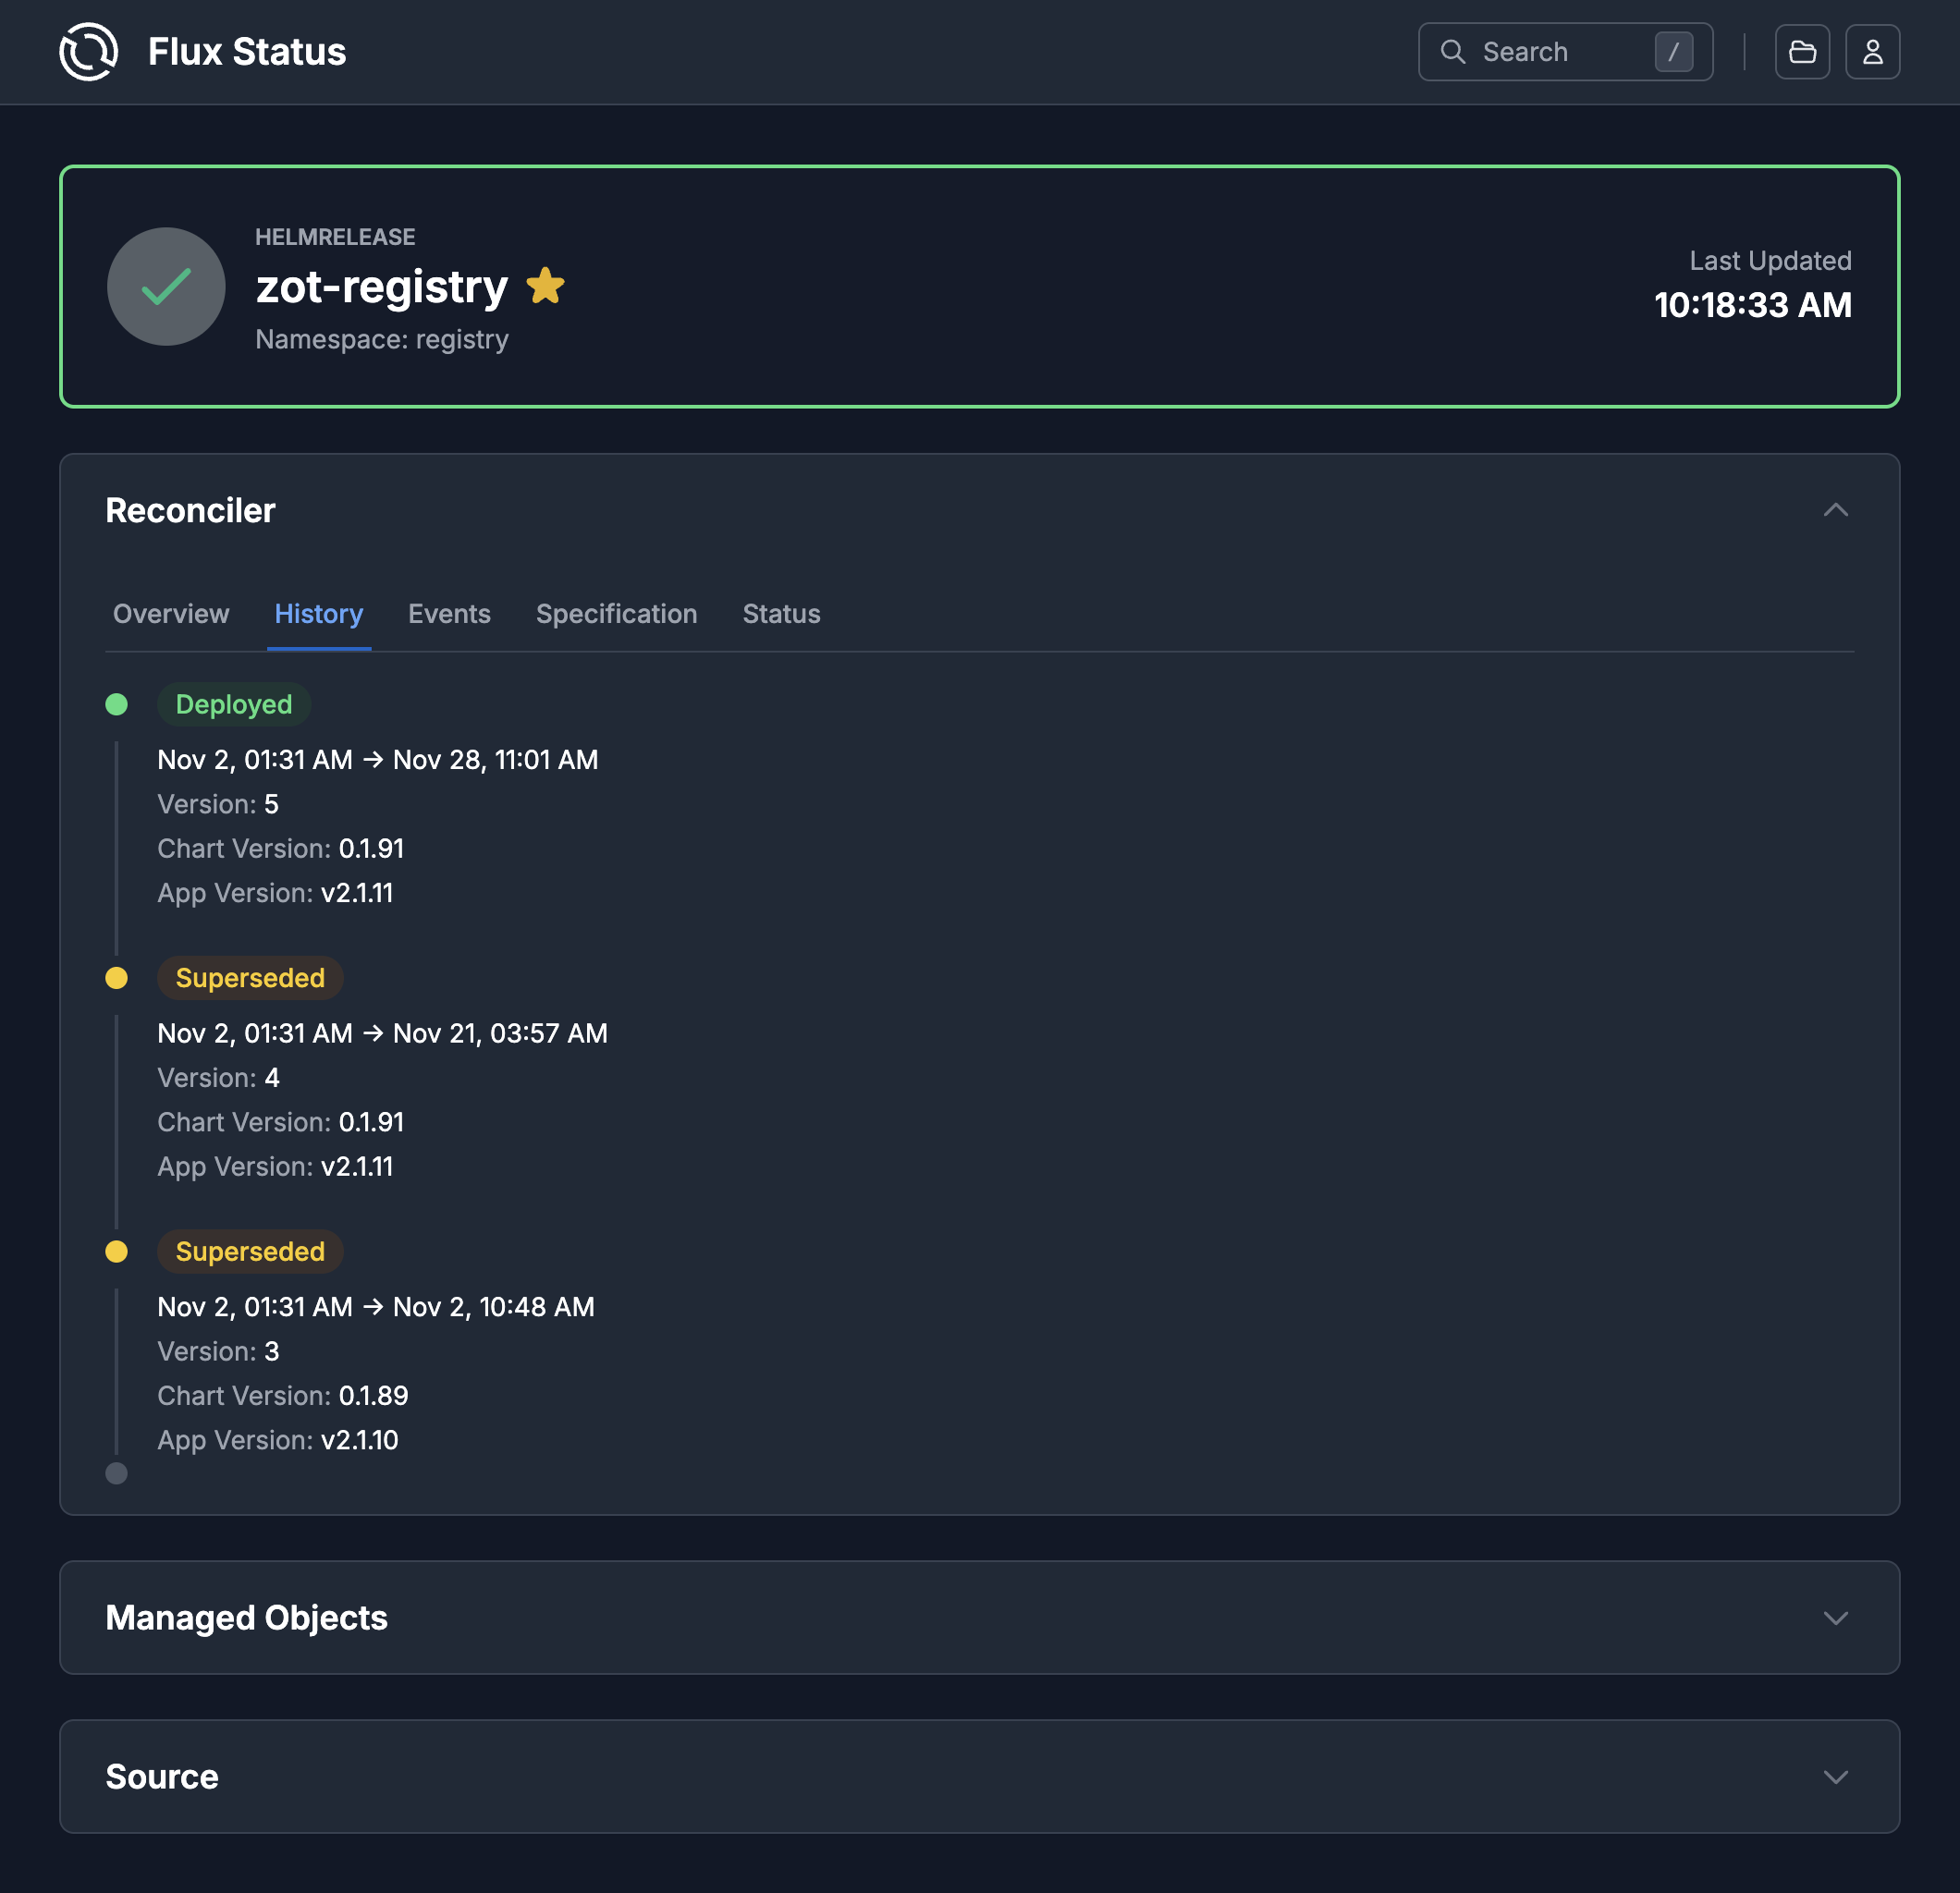
Reconciliation History
Track changes over time with the reconciliation history view. See when resources were updated, what changed, and identify patterns in your deployment pipeline.
Single Sign-On
Secure access with your organization identity provider. The builtin OpenID Connect support allows seamless SSO integration, leveraging Kubernetes RBAC for fine-grained access control.